Pizza Hut 2000 Annual Report Download - page 7
Download and view the complete annual report
Please find page 7 of the 2000 Pizza Hut annual report below. You can navigate through the pages in the report by either clicking on the pages listed below, or by using the keyword search tool below to find specific information within the annual report.-
 1
1 -
 2
2 -
 3
3 -
 4
4 -
 5
5 -
 6
6 -
 7
7 -
 8
8 -
 9
9 -
 10
10 -
 11
11 -
 12
12 -
 13
13 -
 14
14 -
 15
15 -
 16
16 -
 17
17 -
 18
18 -
19
-
20
-
21
-
22
-
23
-
24
-
25
-
26
-
27
-
28
-
29
-
30
-
31
-
32
-
33
-
34
-
35
-
36
-
37
-
38
-
39
-
40
-
41
-
42
-
43
-
44
-
45
-
46
-
47
-
48
-
49
-
50
-
51
-
52
-
53
-
54
-
55
-
56
-
57
-
58
-
59
-
60
-
61
-
62
-
63
-
64
-
65
-
66
-
67
-
68
-
69
-
70
-
71
-
72
 |
 |

TRICON GLOBAL RESTAURANTS 5
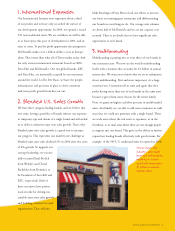
return on invested capital improving to
18%, which we believe leads the industry and
is up 10 percentage points from 1997. In 2000,
we invested in 370 new company restaurants,
upgraded and remodeled 289 company restau-
rants, handled the AmeriServe problem and
purchased over $200 million of our shares.
We are confident we will continue to drive high
returns going forward.
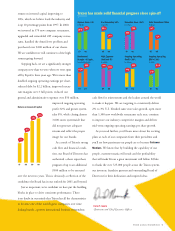
Stepping back, we are a significantly stronger
company now than we were when we were spun
off by PepsiCo three years ago. We’ve more than
doubled ongoing operating earnings per share,
reduced debt by $2.2 billion, improved restau-
rant margins over 3 full points, reduced our
general and administrative expenses over $50 million,
improved ongoing operating
profit 32% and grown system
sales 8%, while closing almost
3,000 stores systemwide that
did not generate adequate
returns and reflect the proper
image for our brands.
As a result of Tricon’s strong
cash flow and financial condi-
tion, our Board of Directors has
authorized a share repurchase
program of up to an additional
$300 million to be executed
over the next two years. This is obviously a reflection of the
confidence the Board has in our outlook for 2001 and beyond.
Just as important, we’re confident we have put the building
blocks in place to drive consistent performance. There
is no doubt in our minds that Tricon has all the characteristics
to become one of the world’s great companies over time:
leading brands, a proven international business, tremendous
Return on Invested Capital
97 0098 99
18%
17%
12%
8%
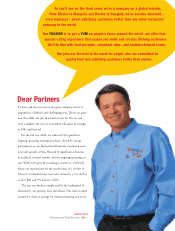
David C. Novak
Chairman and Chief Executive Officer
cash flow for reinvestment and the leaders around the world
to make it happen. We are targeting to consistently deliver
2% to 3% U.S. blended same store sales growth, open more
than 1,300 new worldwide restaurants each year, continue
to improve our industry competitive margins and deliver
mid-teens ongoing operating earnings per share growth.
As you read further, you’ll learn more about the exciting
plans at each of our companies from their presidents and
you’ll see how passionate our people are to become Customer
Maniacs. We know that by building the capability of our
people, customer mania will result and the profitability
that will make Tricon a great investment will follow. I’d like
to thank the over 725,000 people across the Tricon system,
our investors, franchise partners and outstanding Board of
Directors for their dedication and inspired ideas.
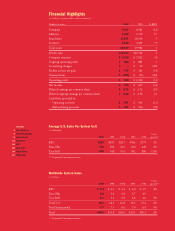
System Sales +8%
In billions
97 00
Restaurant
Margin +3.5ppts.
In percentage points
97 00
Co. Ownership 14%
In percent
97 00
G&A Expense
Declined 8%
In millions
97 00
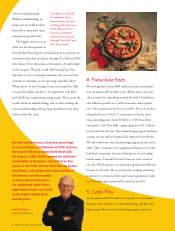
Franchise Fees +36%
In millions
97 00
Ongoing Operating
Profit +32%
In millions
97 00
Debt Reduction 2.2bn
In billions
97 00
Ongoing Operating
EPS +110%
In dollars
97 00
Tricon has made solid financial progress since spin-off
Better (worse)
22.2
20.5
15.1
11.6
20%
34%
879
956
788
578
888
672
2.5
4.7
2.98
1.42