Pizza Hut 2000 Annual Report Download - page 62
Download and view the complete annual report
Please find page 62 of the 2000 Pizza Hut annual report below. You can navigate through the pages in the report by either clicking on the pages listed below, or by using the keyword search tool below to find specific information within the annual report.-
 1
1 -
2
-
3
-
4
-
5
-
6
-
7
-
8
-
9
-
10
-
11
-
12
-
13
-
14
-
15
-
16
-
17
-
18
-
19
-
20
-
21
-
22
-
23
-
24
-
25
-
26
-
27
-
28
-
29
-
30
-
31
-
32
-
33
-
34
-
35
-
36
-
37
-
38
-
39
-
40
-
41
-
42
-
43
-
44
-
45
-
46
-
47
-
48
-
49
-
50
-
51
-
 52
52 -
 53
53 -
 54
54 -
 55
55 -
 56
56 -
 57
57 -
 58
58 -
 59
59 -
 60
60 -
 61
61 -
 62
62 -
 63
63 -
 64
64 -
 65
65 -
 66
66 -
 67
67 -
 68
68 -
 69
69 -
 70
70 -
 71
71 -
 72
72
 |
 |

60 TRICON GLOBAL RESTAURANTS, INC. AND SUBSIDIARIES
We have available net operating loss and tax credit carry-
forwards totaling $856 million at December 30, 2000 to
reduce future tax of TRICON and certain subsidiaries. The
carryforwards are related to a number of foreign and state
jurisdictions. Of these carryforwards, $13 million expire in
2001 and $760 million expire at various times between 2002
and 2020. The remaining $83 million of carryforwards do
not expire.
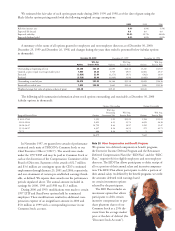
Note 20 Reportable Operating Segments
We are engaged principally in developing, operating, franchising
and licensing the worldwide KFC, Pizza Hut and Taco Bell
concepts. KFC, Pizza Hut and Taco Bell operate throughout
the U.S. and in 84, 87 and 13 countries and territories outside
the U.S., respectively. Our five largest international markets
based on ongoing operating profit in 2000 are Australia, China,
Japan, Korea and the United Kingdom. At December 30, 2000,
we had 10 investments in unconsolidated affiliates outside the
U.S. which operate KFC and/or Pizza Hut restaurants, the
most significant of which are operating in Canada, Japan and
the United Kingdom.
We identify our operating segments based on management
responsibility within the U.S. and International. For purposes
of applying SFAS No. 131 “Disclosure About Segments of An
Enterprise and Related Information” we consider our three
U.S. Concept operating segments to be similar and therefore
have aggregated them into a single reportable operating segment.
Other than the U.S., no individual country represented 10%
or more of our total revenues, profits or assets.
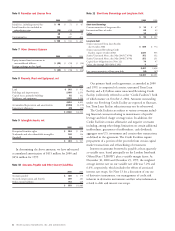
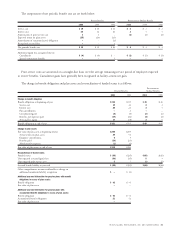
Revenues 2000 1999 1998
United States $5,062 $5,748 $6,439
International 2,031 2,074 2,040
$7,093 $7,822 $8,479
Operating Profit; Interest Expense, Net; and
Income Before Income Taxes 2000 1999 1998
United States $÷«742 $÷«828 $÷«740
International(a) 309 265 191
Foreign exchange (loss) gain –(3) 6
Unallocated and corporate expenses (163) (180) (169)
Facility actions net gain (b) 176 381 275
Unusual items(b) (204) (51) (15)
Total Operating Profit 860 1,240 1,028
Interest expense, net 176 202 272
Income before income taxes $÷«684 $1,038 $÷«756
Depreciation and Amortization 2000 1999 1998
United States $÷«231 $÷«266 $÷«300
International 110 110 104
Corporate 13 10 13
$÷«354 $÷«386 $÷«417
Capital Spending 2000 1999 1998
United States $÷«370 $÷«315 $÷« 305
International 192 139 150
Corporate 10 16 5
$÷«572 $÷«470 $÷«460
Identifiable Assets 2000 1999
United States $2,400 $2,444
International(c) 1,501 1,367
Corporate (d) 248 150
$4,149 $3,961
Long-Lived Assets(e) 2000 1999
United States $2,101 $2,143
International 828 874
Corporate 30 41
$2,959 $3,058
(a) Includes equity income of unconsolidated affiliates of $25 million, $22 mil-
lion and $18 million in 2000, 1999 and 1998, respectively.
(b) See Note 5 for a discussion by reportable operating segment of facility actions
net gain and unusual items.
(c) Includes investment in unconsolidated affiliates of $257 million and
$170 million for 2000 and 1999, respectively.
(d) Primarily includes accounts receivable arising from the AmeriServe
bankruptcy reorganization process as further discussed in Note 21, PP&E
related to our office facilities and restricted cash.
(e) Includes PP&E, net and Intangible Assets, net.
See Note 5 for additional operating segment disclosures
related to impairment and the carrying amount of assets held
for disposal.
Note 21 Commitments and Contingencies
Impact of AmeriServe Bankruptcy Reorganization Process
Overview
We and our franchisees and licensees are dependent on fre-
quent replenishment of food ingredients and paper supplies
required by our restaurants. We and a large number of our
franchisees and licensees operated under multi-year contracts,
which have now been assumed by McLane Company, Inc.
(“McLane”), which required the use of AmeriServe to purchase
and make deliveries of most of these supplies. AmeriServe
filed for protection under Chapter 11 of the U.S. Bankruptcy
Code on January 31, 2000. A plan of reorganization for
AmeriServe (the “POR”) was approved by the U.S. Bankruptcy
Court on November 28, 2000.
During the AmeriServe bankruptcy reorganization process,
we took a number of actions to ensure continued supply to
our system. These actions, which are described below, have
resulted in a total net expense of $170 million in 2000, which
has been recorded as unusual items. Based upon the actions
contemplated by the POR which have been completed to
date and other currently available information, we believe