Pizza Hut 2000 Annual Report Download - page 45
Download and view the complete annual report
Please find page 45 of the 2000 Pizza Hut annual report below. You can navigate through the pages in the report by either clicking on the pages listed below, or by using the keyword search tool below to find specific information within the annual report.-
 1
1 -
2
-
3
-
4
-
5
-
6
-
7
-
8
-
9
-
10
-
11
-
12
-
13
-
14
-
15
-
16
-
17
-
18
-
19
-
20
-
21
-
22
-
23
-
24
-
25
-
26
-
27
-
28
-
29
-
30
-
31
-
32
-
33
-
34
-
 35
35 -
 36
36 -
 37
37 -
 38
38 -
 39
39 -
 40
40 -
 41
41 -
 42
42 -
 43
43 -
 44
44 -
 45
45 -
 46
46 -
 47
47 -
 48
48 -
 49
49 -
 50
50 -
 51
51 -
 52
52 -
 53
53 -
 54
54 -
 55
55 -
56
-
57
-
58
-
59
-
60
-
61
-
62
-
63
-
64
-
65
-
66
-
67
-
68
-
69
-
70
-
71
-
72
 |
 |

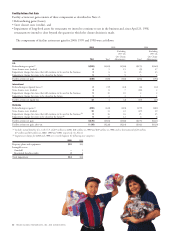
TRICON GLOBAL RESTAURANTS, INC. AND SUBSIDIARIES 43
Accumulated
Other
Issued Common Stock Accumulated Comprehensive
(in millions) Shares Amount Deficit Income Total
Balance at December 27, 1997 152 $1,271 $(2,763) $(128) $(1,620)
Net income 445 445
Foreign currency translation adjustment (20) (20)
Minimum pension liability adjustment
(includes tax of $1 million) (2) (2)
Comprehensive Income 423
Adjustment to opening equity related to
net advances from PepsiCo 12 12
Stock option exercises
(includes tax benefits of $3 million) 122 22
Balance at December 26, 1998 153 $1,305 $(2,318) $(150) $(1,163)
Net income 627 627
Foreign currency translation adjustment 15 15
Minimum pension liability adjustment
(includes tax of $1 million) 22
Comprehensive Income 644
Adjustment to opening equity related to
net advances from PepsiCo 77
Repurchase of shares of common stock (3) (134) (134)
Stock option exercises
(includes tax benefits of $14 million) 139 39
Compensation-related events 47 47
Balance at December 25, 1999 151 $1,264 $(1,691) $(133) $÷«(560)
Net income 413 413
Foreign currency translation adjustment (44) (44)
Comprehensive Income 369
Repurchase of shares of common stock (6) (216) (216)
Stock option exercises
(includes tax benefits of $5 million) 246 46
Compensation-related events 39 39
Balance at December 30, 2000 147 $1,133 $(1,278) $(177) $÷«(322)
See accompanying Notes to Consolidated Financial Statements.
Consolidated Statements of Shareholders’ Deficit
and Comprehensive Income
Fiscal years ended December 30, 2000, December 25, 1999 and December 26, 1998