Pizza Hut 2000 Annual Report Download - page 35
Download and view the complete annual report
Please find page 35 of the 2000 Pizza Hut annual report below. You can navigate through the pages in the report by either clicking on the pages listed below, or by using the keyword search tool below to find specific information within the annual report.-
 1
1 -
2
-
3
-
4
-
5
-
6
-
7
-
8
-
9
-
10
-
11
-
12
-
13
-
14
-
15
-
16
-
17
-
18
-
19
-
20
-
21
-
22
-
23
-
24
-
 25
25 -
 26
26 -
 27
27 -
 28
28 -
 29
29 -
 30
30 -
 31
31 -
 32
32 -
 33
33 -
 34
34 -
 35
35 -
 36
36 -
 37
37 -
 38
38 -
 39
39 -
 40
40 -
 41
41 -
 42
42 -
 43
43 -
 44
44 -
 45
45 -
46
-
47
-
48
-
49
-
50
-
51
-
52
-
53
-
54
-
55
-
56
-
57
-
58
-
59
-
60
-
61
-
62
-
63
-
64
-
65
-
66
-
67
-
68
-
69
-
70
-
71
-
72
 |
 |

TRICON GLOBAL RESTAURANTS, INC. AND SUBSIDIARIES 33
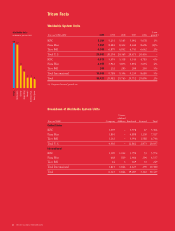
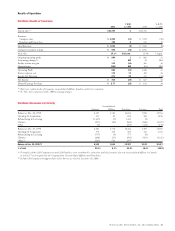
U.S. System Sales
System sales were essentially flat in 2000. Excluding the
favorable impact of the fifty-third week in 2000, system sales
decreased 2%. The decrease was due to same stores sales
declines at Taco Bell and KFC as well as store closures, par-
tially offset by new unit development.
In 1999, system sales increased $503 million or 4%. The
improvement was driven by new unit development and same
store sales growth. These increases were partially offset by
store closures.
U.S. Revenues
Company sales decreased $720 million or 14%. As expected,
the decline in Company sales was due to the Portfolio Effect
partially offset by the favorable impact from the fifty-third week
in 2000. Excluding these items, Company sales increased 1%
in 2000. This increase was primarily due to new unit devel-
opment and favorable Effective Net Pricing almost fully
offset by volume declines.
In 2000, U.S. blended Company same store sales for our
three Concepts decreased 2%. The decline in transactions of
4% was partially offset by favorable Effective Net Pricing of
2%. Same store sales at Pizza Hut increased 1%. Favorable
Effective Net Pricing of 3% was partially offset by transaction
declines of 2%. Same store sales at KFC decreased 3%, primar-
ily due to transaction declines. Same store sales at Taco Bell
decreased 5% as a result of transaction declines.
Franchise and license fees grew $34 million or 7% in 2000.
Excluding the favorable impact from the fifty-third week in
2000, franchise and license fees increased 5%. The increase
was driven by units acquired from us and new unit develop-
ment, partially offset by franchisee same store sales declines
and store closures.
In 1999, Company sales declined $760 million or 13%.
As expected, the decline in Company sales was due to the
Portfolio Effect. Excluding the Portfolio Effect, Company sales
increased 6%. This increase was primarily due to new unit
development, favorable Effective Net Pricing and volume
increases led by the launch of “The Big New Yorker” pizza.
In 1999, U.S. blended same stores sales for our three
Concepts increased 4%. Favorable Effective Net Pricing of
5% was partially offset by a 1% decline in transactions. Same
store sales at Pizza Hut increased 9% in 1999. The improve-
ment was primarily driven by an increase in transactions of
over 5%, resulting from the launch of “The Big New Yorker.”
The growth at Pizza Hut was also aided by Effective Net
Pricing of over 3%. Same store sales at KFC grew 2%. The
increase was almost equally driven by Effective Net Pricing
and transaction growth. Same store sales at Taco Bell were
flat as an increase in Effective Net Pricing of approximately
4% was fully offset by transaction declines.
Franchise and license fees increased $69 million or 16%
in 1999. The increase was driven by units acquired from us,
new unit development and franchisee same store sales growth,
primarily at Pizza Hut. These increases were partially offset
by store closures.
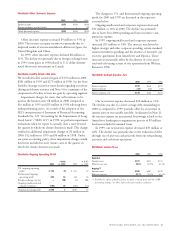
U.S. Company Restaurant Margin
2000 1999 1998
Company sales 100.0% 100.0% 100.0%
Food and paper 28.6 30.0 31.0
Payroll and employee benefits 30.8 29.8 30.4
Occupancy and other operating expenses 25.4 24.5 25.0
Restaurant margin 15.2% 15.7% 13.6%
Restaurant margin as a percentage of sales decreased
approximately 55 basis points in 2000, including the unfavor-
able impact of nearly 25 basis points from lapping the 1999
accounting changes. Restaurant margin included 70 basis
points related to the favorable impact of the Portfolio Effect.
Excluding these items, our base restaurant margin declined
approximately 100 basis points. This decrease included approx-
imately 60 basis points resulting from the absence of favorable
1999 insurance-related adjustments of $30 million, which are
more fully discussed in Note 21. The remaining decrease was
due to a shift to lower margin chicken sandwiches at KFC
and volume declines at Taco Bell, partially offset by Effective
Net Pricing. Favorable commodity costs, primarily cheese,
were almost fully offset by higher occupancy and other costs
as well as increased wage rates.
In 1999, our restaurant margin as a percentage of sales
increased approximately 210 basis points. The Portfolio Effect
contributed approximately 45 basis points and accounting
changes contributed nearly 25 basis points to the improve-
ment. Excluding these items, our base restaurant margin grew
approximately 140 basis points. The increase was primarily