Pizza Hut 2000 Annual Report Download - page 42
Download and view the complete annual report
Please find page 42 of the 2000 Pizza Hut annual report below. You can navigate through the pages in the report by either clicking on the pages listed below, or by using the keyword search tool below to find specific information within the annual report.-
 1
1 -
2
-
3
-
4
-
5
-
6
-
7
-
8
-
9
-
10
-
11
-
12
-
13
-
14
-
15
-
16
-
17
-
18
-
19
-
20
-
21
-
22
-
23
-
24
-
25
-
26
-
27
-
28
-
29
-
30
-
31
-
 32
32 -
 33
33 -
 34
34 -
 35
35 -
 36
36 -
 37
37 -
 38
38 -
 39
39 -
 40
40 -
 41
41 -
 42
42 -
 43
43 -
 44
44 -
 45
45 -
 46
46 -
 47
47 -
 48
48 -
 49
49 -
 50
50 -
 51
51 -
 52
52 -
53
-
54
-
55
-
56
-
57
-
58
-
59
-
60
-
61
-
62
-
63
-
64
-
65
-
66
-
67
-
68
-
69
-
70
-
71
-
72
 |
 |

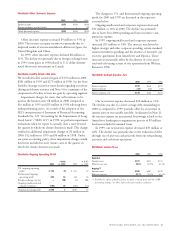
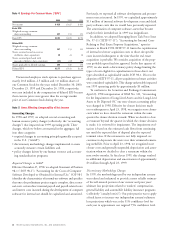
40 TRICON GLOBAL RESTAURANTS, INC. AND SUBSIDIARIES
(in millions, except per share amounts) 2000 1999 1998
Revenues
Company sales $6,305 $7,099 $7,852
Franchise and license fees 788 723 627
7,093 7,822 8,479
Costs and Expenses, net
Company restaurants
Food and paper 1,942 2,238 2,521
Payroll and employee benefits 1,744 1,956 2,243
Occupancy and other operating expenses 1,665 1,814 2,030
5,351 6,008 6,794
General and administrative expenses 879 920 941
Other (income) expense (25) (16) (24)
Facility actions net (gain) (176) (381) (275)
Unusual items 204 51 15
Total costs and expenses, net 6,233 6,582 7,451
Operating Profit 860 1,240 1,028
Interest expense, net 176 202 272
Income Before Income Taxes 684 1,038 756
Income Tax Provision 271 411 311
Net Income $÷«413 $÷«627 $÷«445
Basic Earnings Per Common Share $÷2.81 $÷4.09 $÷2.92
Diluted Earnings Per Common Share $÷2.77 $÷3.92 $÷2.84
See accompanying Notes to Consolidated Financial Statements.
Consolidated Statements of Income
Fiscal years ended December 30, 2000, December 25, 1999 and December 26, 1998