Pizza Hut 2000 Annual Report Download - page 32
Download and view the complete annual report
Please find page 32 of the 2000 Pizza Hut annual report below. You can navigate through the pages in the report by either clicking on the pages listed below, or by using the keyword search tool below to find specific information within the annual report.-
 1
1 -
2
-
3
-
4
-
5
-
6
-
7
-
8
-
9
-
10
-
11
-
12
-
13
-
14
-
15
-
16
-
17
-
18
-
19
-
20
-
21
-
 22
22 -
 23
23 -
 24
24 -
 25
25 -
 26
26 -
 27
27 -
 28
28 -
 29
29 -
 30
30 -
 31
31 -
 32
32 -
 33
33 -
 34
34 -
 35
35 -
 36
36 -
 37
37 -
 38
38 -
 39
39 -
 40
40 -
 41
41 -
 42
42 -
43
-
44
-
45
-
46
-
47
-
48
-
49
-
50
-
51
-
52
-
53
-
54
-
55
-
56
-
57
-
58
-
59
-
60
-
61
-
62
-
63
-
64
-
65
-
66
-
67
-
68
-
69
-
70
-
71
-
72
 |
 |

30 TRICON GLOBAL RESTAURANTS, INC. AND SUBSIDIARIES
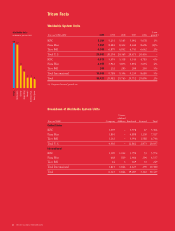
Worldwide System Sales
System sales increased $397 million or 2% in 2000, after a 1%
unfavorable impact from foreign currency translation. Exclud-
ing the negative impact of foreign currency translation and the
favorable impact of the fifty-third week, system sales increased
1%. This increase was driven by new unit development, par-
tially offset by store closures and same store sales declines.
In 1999, system sales increased $1.1 billion or 6%. The
improvement was driven by new unit development and same
store sales growth. U.S. development was primarily at Taco
Bell while International development was primarily in Asia.
The increase was partially offset by store closures.
Worldwide Revenues
Company sales decreased $794 million or 11% in 2000. As
expected, the decline in Company sales was primarily due to
the Portfolio Effect partially offset by the favorable impact
from the fifty-third week in 2000. Excluding these items,
Company sales increased 4%. This increase was primarily
due to new unit development and favorable Effective Net
Pricing, partially offset by volume declines. Effective Net
Pricing includes increases or decreases in price and the effect
of changes in product mix.
Franchise and license fees increased approximately $65 mil-
lion or 9% in 2000. The increase was driven by units acquired
from us and new unit development, partially offset by store
closures and franchisee same store sales declines in the U.S.
The negative impact of foreign currency translation was
essentially offset by the favorable impact from the fifty-third
week in 2000.
Company sales decreased $753 million or 10% in 1999.
As expected, the decline in Company sales was due to the
Portfolio Effect. Excluding the Portfolio Effect, Company sales
increased 8%. The increase was primarily due to new unit
development, favorable Effective Net Pricing and volume
increases in the U.S. and International. The volume increase in
the U.S. was led by the launch of “The Big New Yorker” pizza.
Franchise and license fees grew $96 million or 15% in
1999. The growth was primarily driven by units acquired from
us and new unit development, primarily in Asia and at Taco
Bell in the U.S., partially offset by store closures by franchisees
and licensees.
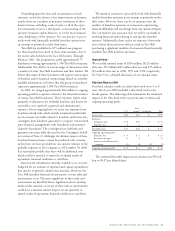
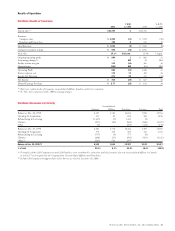
Worldwide Company Restaurant Margin
2000 1999 1998
Company sales 100.0% 100.0% 100.0%
Food and paper 30.8 31.5 32.1
Payroll and employee benefits 27.7 27.6 28.6
Occupancy and other operating expenses 26.4 25.5 25.8
Restaurant margin 15.1% 15.4% 13.5%
Restaurant margin as a percentage of sales decreased
approximately 25 basis points in 2000, including the unfa-
vorable impact of 15 basis points from lapping the 1999
accounting changes. Restaurant margin included 70 basis
points related to the favorable impact of the Portfolio Effect.
Excluding the net effect of these items, our base restaurant
margin declined approximately 80 basis points. Approximately
40 basis points of this decrease resulted from the favorable
1999 U.S. insurance-related adjustments of $30 million,
which are more fully discussed in Note 21. The remaining
decrease was primarily due to a decline in U.S. restaurant
margin, as discussed in the U.S. Restaurant Margin section.
In 1999, our restaurant margin as a percentage of sales
increased approximately 190 basis points. The Portfolio Effect
contributed nearly 50 basis points and accounting changes
contributed approximately 15 basis points to our improve-
ment. Excluding these items, our base restaurant margin
increased approximately 125 basis points. This improvement
was primarily attributable to Effective Net Pricing in excess
of cost increases (primarily higher wage rates) in the U.S.
Restaurant margin also benefited from improved food and
paper cost management in both the U.S. and certain key
International equity markets. Volume increases at Pizza Hut
in the U.S. and in certain key International equity markets
were fully offset by volume declines at Taco Bell and the
unfavorable impact of the introduction of lower margin
chicken sandwiches at KFC in the U.S.
Worldwide General & Administrative Expenses
G&A declined $41 million or 4% in 2000. Excluding the
benefit from lapping the 1999 accounting changes, ongoing
G&A decreased $59 million or 6%. The decrease was primar-
ily due to lower incentive compensation expense and Year
2000 costs as well as the favorable impact of the Portfolio
Effect. Reduced spending on conferences also contributed
to the decline. The decrease was partially offset by higher
franchise-related expenses, primarily allowances for doubtful
franchise and license fee receivables, as more fully discussed
in the Franchisee Financial Condition section. G&A included
Year 2000 spending of approximately $2 million in 2000 as
compared to approximately $30 million in 1999.
In 1999, G&A decreased $21 million or 2%. Excluding
the $18 million favorable impact of the 1999 accounting
changes, G&A decreased $3 million. The favorable impacts
of the Portfolio Effect, our fourth quarter 1998 decision to
streamline our international business and the absence of costs
associated with relocating certain operations from Wichita,
Kansas in 1998 were partially offset by higher strategic and
other corporate expenses. In addition, higher spending on
conferences and the absence of favorable cost recovery agree-
ments with AmeriServe and PepsiCo also partially offset the
decreases discussed above.