Pizza Hut 2000 Annual Report Download - page 59
Download and view the complete annual report
Please find page 59 of the 2000 Pizza Hut annual report below. You can navigate through the pages in the report by either clicking on the pages listed below, or by using the keyword search tool below to find specific information within the annual report.-
 1
1 -
2
-
3
-
4
-
5
-
6
-
7
-
8
-
9
-
10
-
11
-
12
-
13
-
14
-
15
-
16
-
17
-
18
-
19
-
20
-
21
-
22
-
23
-
24
-
25
-
26
-
27
-
28
-
29
-
30
-
31
-
32
-
33
-
34
-
35
-
36
-
37
-
38
-
39
-
40
-
41
-
42
-
43
-
44
-
45
-
46
-
47
-
48
-
 49
49 -
 50
50 -
 51
51 -
 52
52 -
 53
53 -
 54
54 -
 55
55 -
 56
56 -
 57
57 -
 58
58 -
 59
59 -
 60
60 -
 61
61 -
 62
62 -
 63
63 -
 64
64 -
 65
65 -
 66
66 -
 67
67 -
 68
68 -
 69
69 -
70
-
71
-
72
 |
 |

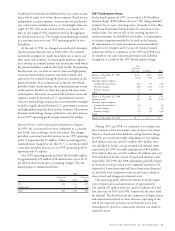
We estimated the fair value of each option grant made during 2000, 1999 and 1998 as of the date of grant using the
Black-Scholes option pricing model with the following weighted average assumptions:
2000 1999 1998
Risk-free interest rate 6.4% 4.9% 5.5%
Expected life (years) 6.0 6.0 6.0
Expected volatility 32.6% 29.7% 28.8%
Expected dividend yield 0.0% 0.0% 0.0%
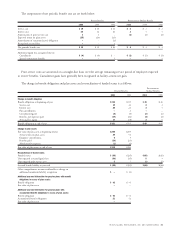
A summary of the status of all options granted to employees and non-employee directors as of December 30, 2000,
December 25, 1999 and December 26, 1998, and changes during the years then ended is presented below (tabular options
in thousands):
December 30, 2000 December 25, 1999 December 26, 1998
Wtd. Avg. Wtd. Avg. Wtd. Avg.
Options Exercise Price Options Exercise Price Options Exercise Price
Outstanding at beginning of year 24,166 $31.18 22,699 $26.16 15,245 $23.03
Granted at price equal to average market price 7,860 30.33 5,709 49.07 12,084 29.37
Exercised (1,829) 21.84 (1,273) 19.51 (962) 18.93
Forfeited (3,518) 33.99 (2,969) 31.94 (3,668) 25.60
Outstanding at end of year 26,679 $31.20 24,166 $31.18 22,699 $26.16
Exercisable at end of year 7,622 $24.59 3,665 $22.44 3,006 $21.16
Weighted average fair value of options at date of grant $13.48 $19.20 $11.65
The following table summarizes information about stock options outstanding and exercisable at December 30, 2000
(tabular options in thousands):
Options Outstanding Options Exercisable
Wtd. Avg.
Remaining Wtd. Avg. Wtd. Avg.
Range of Exercise Prices Options Contractual Life Exercise Price Options Exercise Price
$÷0.01 –17.80 1,395 3.91 $15.22 1,394 $15.22
÷22.02–29.84 9,692 6.23 25.74 4,659 24.38
÷30.28–34.47 10,799 8.44 30.97 1,292 31.47
÷35.13–46.97 4,307 8.16 44.53 272 42.71
÷72.75 486 8.26 72.75 5 72.75
26,679 7,622
In November 1997, we granted two awards of performance
restricted stock units of TRICON’s Common Stock to our
Chief Executive Officer (“CEO”). The awards were made
under the 1997 LTIP and may be paid in Common Stock or
cash at the discretion of the Compensation Committee of the
Board of Directors. Payments of the awards of $2.7 million
and $3.6 million are contingent upon the CEO’s continued
employment through January 25, 2001 and 2006, respectively,
and our attainment of certain pre-established earnings thresh-
olds, as defined. We expense these awards over the performance
periods stipulated above. The annual amount included in
earnings for 2000, 1999 and 1998 was $1.3 million.
During 2000 and 1999, modifications were made to certain
1997 LTIP and SharePower options held by terminated
employees. These modifications resulted in additional com-
pensation expense of an insignificant amount in 2000 and
$5.0 million in 1999 with a corresponding increase in our
Common Stock account.
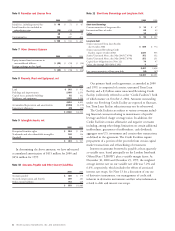
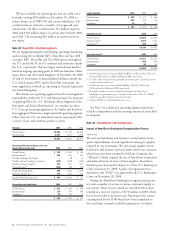
Note 16 Other Compensation and Benefit Programs
We sponsor two deferred compensation benefit programs,
the Executive Income Deferral Program and the Restaurant
Deferred Compensation Plan (the “EID Plan” and the “RDC
Plan,” respectively) for eligible employees and non-employee
directors. The EID Plan allows participants to defer receipt of
all or a portion of their annual salary and incentive compensa-
tion. The RDC Plan allows participants to defer a portion of
their annual salary. As defined by the benefit programs, we credit
the amounts deferred with earnings based
on certain investment options
selected by the participants.
The EID Plan includes an
investment option that allows
participants to defer certain
incentive compensation to pur-
chase phantom shares of our
Common Stock at a 25% dis-
count from the average market
price at the date of deferral (the
“Discount Stock Account”).