Pizza Hut 2000 Annual Report Download - page 2
Download and view the complete annual report
Please find page 2 of the 2000 Pizza Hut annual report below. You can navigate through the pages in the report by either clicking on the pages listed below, or by using the keyword search tool below to find specific information within the annual report.-
 1
1 -
 2
2 -
 3
3 -
 4
4 -
 5
5 -
 6
6 -
 7
7 -
 8
8 -
 9
9 -
 10
10 -
 11
11 -
 12
12 -
 13
13 -
14
-
15
-
16
-
17
-
18
-
19
-
20
-
21
-
22
-
23
-
24
-
25
-
26
-
27
-
28
-
29
-
30
-
31
-
32
-
33
-
34
-
35
-
36
-
37
-
38
-
39
-
40
-
41
-
42
-
43
-
44
-
45
-
46
-
47
-
48
-
49
-
50
-
51
-
52
-
53
-
54
-
55
-
56
-
57
-
58
-
59
-
60
-
61
-
62
-
63
-
64
-
65
-
66
-
67
-
68
-
69
-
70
-
71
-
72
 |
 |

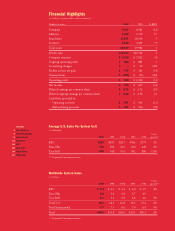
Financial Highlights
(in millions, except per share and unit amounts)
5-year
2000 1999 1998 1997 1996 growth
KFC $823 $837 $817 $786 $775 2%
Pizza Hut 712 696 645 630 620 2%
Taco Bell 896 918 931 902 886 (1)%
(a) Compounded annual growth rate
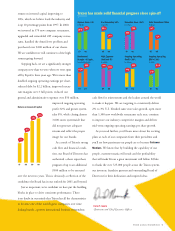
Average U.S. Sales Per System Unit
(in thousands)
5-year
2000 1999 1998 1997 1996 growth
KFC $÷4.4 $÷4.3 $÷4.2 $÷4.0 $÷3.9 4%
Pizza Hut 5.0 5.0 4.8 4.7 4.9 –
Taco Bell 5.1 5.2 5.0 4.8 4.6 3%
Total U.S. 14.5 14.5 14.0 13.5 13.4 2%
Total International 7.7 7.3 6.6 7.0 6.9 3%
Total $22.2 $21.8 $20.6 $20.5 $20.3 2%
(a) Compounded annual growth rate
Worldwide System Sales
(in billions)
Contents
1Dear Partners
6Customer Mania!
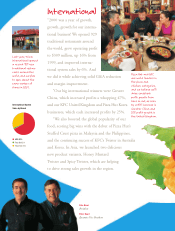
8International
12 Pizza Hut
16 KFC
20 Taco Bell
24 Tricon Facts
26 Financials
Number of stores: 2000 1999 % B(W)
Company 6,123 6,981 (12)
Affiliates 1,844 1,178 57
Franchisees 19,287 18,414 5
Licensees 3,163 3,409 (7)
Total stores 30,417 29,982 1
System sales $22,159 $21,762 2
Company revenues $÷7,093 $÷7,822 (9)
Ongoing operating profit $÷÷«888 $÷÷«881 1
Accounting changes $÷÷÷÷«– $÷÷÷«29 NM
Facility actions net gain $÷÷«176 $÷÷«381 (54)
Unusual items $÷÷(204) $÷÷÷(51) NM
Operating profit $÷÷«860 $÷1,240 (31)
Net income $÷÷«413 $÷÷«627 (34)
Diluted earnings per common share $÷÷2.77 $÷÷3.92 (29)
Diluted ongoing earnings per common share $÷÷2.98 $÷÷2.58 16
Cash flows provided by:
Operating activities $÷÷«491 $÷÷«565 (13)
Refranchising proceeds $÷÷«381 $÷÷«916 (58)
(a)
(a)