Pizza Hut 2000 Annual Report Download - page 37
Download and view the complete annual report
Please find page 37 of the 2000 Pizza Hut annual report below. You can navigate through the pages in the report by either clicking on the pages listed below, or by using the keyword search tool below to find specific information within the annual report.-
 1
1 -
2
-
3
-
4
-
5
-
6
-
7
-
8
-
9
-
10
-
11
-
12
-
13
-
14
-
15
-
16
-
17
-
18
-
19
-
20
-
21
-
22
-
23
-
24
-
25
-
26
-
 27
27 -
 28
28 -
 29
29 -
 30
30 -
 31
31 -
 32
32 -
 33
33 -
 34
34 -
 35
35 -
 36
36 -
 37
37 -
 38
38 -
 39
39 -
 40
40 -
 41
41 -
 42
42 -
 43
43 -
 44
44 -
 45
45 -
 46
46 -
 47
47 -
48
-
49
-
50
-
51
-
52
-
53
-
54
-
55
-
56
-
57
-
58
-
59
-
60
-
61
-
62
-
63
-
64
-
65
-
66
-
67
-
68
-
69
-
70
-
71
-
72
 |
 |

TRICON GLOBAL RESTAURANTS, INC. AND SUBSIDIARIES 35
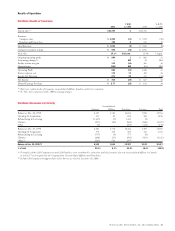
International System Sales
System sales increased $399 million or 6% in 2000, after
a 2% unfavorable impact from foreign currency translation.
Excluding the negative impact of foreign currency translation
and the favorable impact of the fifty-third week in 2000, sys-
tem sales increased 7%. This increase was driven by new unit
development, led by China, Korea and Japan and same store
sales growth. The increase was partially offset by store closures.
In 1999, system sales increased $639 million or 10%,
including a 2% favorable impact from foreign currency trans-
lation. This increase was largely driven by strong performance
in Asia, where system sales increased $426 million or 19%,
including a 10% favorable impact of foreign currency transla-
tion. In 1999, the economy in Asia began to show signs of a
steady recovery after the overall economic turmoil and weak-
ening of local currencies against the U.S. dollar that began in
late 1997. The increase in system sales in Asia was driven by
new unit development and same store sales growth. Outside
of Asia, the improvement was driven by new unit development
and same store sales growth. The increases were partially off-
set by store closures primarily by franchisees in Canada,
Latin America and Japan.
International Revenues
Company sales decreased $74 million or 4% in 2000, after
a 3% unfavorable impact from foreign currency translation.
As expected, the decline in Company sales was primarily due
to the Portfolio Effect partially offset by the favorable impact
from the fifty-third week in 2000. Excluding all three of
these items, Company sales increased 11% primarily due to
new unit development and favorable Effective Net Pricing.
Franchise and license fees increased approximately $31 mil-
lion or 14% in 2000, after a 3% unfavorable impact from
foreign currency translation. Excluding the negative impact of
foreign currency translation and the favorable impact from the
fifty-third week in 2000, franchise and license fees increased
16%. The increase was driven by new unit development, units
acquired from us and franchisee same store sales growth. These
increases were partially offset by store closures.
Company sales increased less than 1% in 1999. Excluding
the Portfolio Effect, Company sales increased 13% largely
driven by the strong performance in Asia. The increase was
primarily due to new unit development, favorable Effective
Net Pricing and volume increases.
Franchise and license fees rose $27 million or 13% in 1999.
The increase in franchise and license fees was driven by new
unit development, franchisee same store sales growth and
units acquired from us. New unit development was primarily
in Asia. These increases were partially offset by store closures.
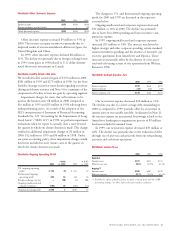
International Company Restaurant Margin
2000 1999 1998
Company sales 100.0% 100.0% 100.0%
Food and paper 36.5 36.0 35.8
Payroll and employee benefits 19.5 21.0 22.6
Occupancy and other operating expenses 28.9 28.6 28.6
Restaurant margin 15.1% 14.4% 13.0%
Restaurant margin as a percentage of sales increased approx-
imately 65 basis points in 2000. Excluding the Portfolio Effect
of approximately 70 basis points, base restaurant margin was
essentially flat.
Restaurant margin as a percentage of sales increased approx-
imately 140 basis points in 1999. Excluding the favorable
impact of foreign currency translation, restaurant margin
increased approximately 130 basis points. Portfolio Effect
contributed approximately 50 basis points. Excluding these
items, our base restaurant margin grew approximately 80 basis
points. The improvement was driven by volume increases in
China, Korea and Australia and favorable Effective Net Pricing
in excess of cost increases, primarily in the United Kingdom,
Puerto Rico and Korea. Our growth in 1999 was partially
offset by volume decreases in Taiwan and Poland. In addition
to the factors described above, restaurant margin benefited
from improved cost management, primarily in China.
International Ongoing Operating Profit
Ongoing operating profit grew $44 million or 16% in 2000,
after a 2% unfavorable impact from foreign currency trans-
lation. Excluding the negative impacts of the Portfolio Effect
and foreign currency translation and the favorable impact
from the fifty-third week in 2000, ongoing operating profit
grew 19%. Higher franchise and license fees and Company
new unit development drove the increase.
In 1999, ongoing operating profit grew $74 million or
39%, including a 3% favorable impact from foreign currency
translation. The increase in operating profit was driven by our
base margin improvement of approximately 80 basis points,
higher franchise and license fees and a decline in G&A.
Ongoing operating profit benefited from the economic recov-
ery in Asia. Operating profit in Asia increased $55 million or
84%, including a 12% favorable impact from foreign currency
translation. Additionally, ongoing operating profit included
benefits of approximately $15 million principally from our
1998 fourth quarter decision to streamline our international
infrastructure in Asia, Europe and Latin America.