Pizza Hut 2000 Annual Report Download - page 67
Download and view the complete annual report
Please find page 67 of the 2000 Pizza Hut annual report below. You can navigate through the pages in the report by either clicking on the pages listed below, or by using the keyword search tool below to find specific information within the annual report.-
 1
1 -
2
-
3
-
4
-
5
-
6
-
7
-
8
-
9
-
10
-
11
-
12
-
13
-
14
-
15
-
16
-
17
-
18
-
19
-
20
-
21
-
22
-
23
-
24
-
25
-
26
-
27
-
28
-
29
-
30
-
31
-
32
-
33
-
34
-
35
-
36
-
37
-
38
-
39
-
40
-
41
-
42
-
43
-
44
-
45
-
46
-
47
-
48
-
49
-
50
-
51
-
52
-
53
-
54
-
55
-
56
-
 57
57 -
 58
58 -
 59
59 -
 60
60 -
 61
61 -
 62
62 -
 63
63 -
 64
64 -
 65
65 -
 66
66 -
 67
67 -
 68
68 -
 69
69 -
 70
70 -
 71
71 -
 72
72
 |
 |

TRICON GLOBAL RESTAURANTS, INC. AND SUBSIDIARIES 65
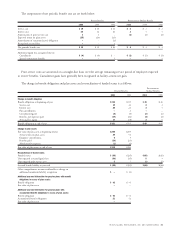
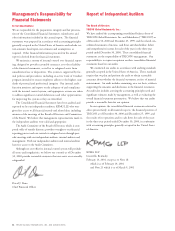
Note 22 Selected Quarterly Financial Data (Unaudited)
2000 First Quarter Second Quarter Third Quarter Fourth Quarter Total
Revenues:
Company sales $1,425 $1,480 $1,470 $1,930 $6,305
Franchise and license fees 172 176 188 252 788
Total revenues 1,597 1,656 1,658 2,182 7,093
Total costs and expenses, net 1,355 1,436 1,526 1,916 6,233
Operating profit 242 220 132 266 860
Net income 120 106 59 128 413
Diluted earnings per common share 0.80 0.71 0.40 0.86 2.77
Operating profit attributable to:
Facility actions net gain 47 66 3 60 176
Unusual items (4) (72) (92) (36) (204)
Net income attributable to:
Facility actions net gain 26 39 3 30 98
Unusual items (2) (47) (57) (23) (129)
1999 First Quarter Second Quarter Third Quarter Fourth Quarter Total
Revenues:
Company sales $1,662 $1,723 $1,639 $2,075 $7,099
Franchise and license fees 151 163 173 236 723
Total revenues 1,813 1,886 1,812 2,311 7,822
Total costs and expenses, net 1,577 1,537 1,435 2,033 6,582
Operating profit 236 349 377 278 1,240
Net income 106 179 197 145 627
Diluted earnings per common share 0.66 1.10 1.23 0.93 3.92
Operating profit attributable to:
Accounting changes 1065829
Facility actions net gain 34 133 144 70 381
Unusual items –(4) (3) (44) (51)
Net income attributable to:
Accounting changes 643518
Facility actions net gain 19 80 84 43 226
Unusual items –(2) (3) (24) (29)
See Note 5 for details of facility actions net gain, unusual items and the 1999 accounting changes.