Pizza Hut 2000 Annual Report Download - page 26
Download and view the complete annual report
Please find page 26 of the 2000 Pizza Hut annual report below. You can navigate through the pages in the report by either clicking on the pages listed below, or by using the keyword search tool below to find specific information within the annual report.-
 1
1 -
2
-
3
-
4
-
5
-
6
-
7
-
8
-
9
-
10
-
11
-
12
-
13
-
14
-
15
-
 16
16 -
 17
17 -
 18
18 -
 19
19 -
 20
20 -
 21
21 -
 22
22 -
 23
23 -
 24
24 -
 25
25 -
 26
26 -
 27
27 -
 28
28 -
 29
29 -
 30
30 -
 31
31 -
 32
32 -
 33
33 -
 34
34 -
 35
35 -
 36
36 -
37
-
38
-
39
-
40
-
41
-
42
-
43
-
44
-
45
-
46
-
47
-
48
-
49
-
50
-
51
-
52
-
53
-
54
-
55
-
56
-
57
-
58
-
59
-
60
-
61
-
62
-
63
-
64
-
65
-
66
-
67
-
68
-
69
-
70
-
71
-
72
 |
 |

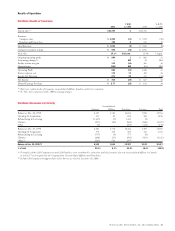
24 TRICON GLOBAL RESTAURANTS
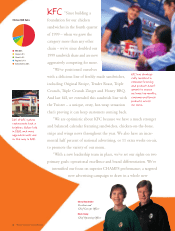
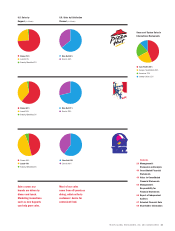
Worldwide System Units
Breakdown of Worldwide System Units
Uncon-
solidated
Year-end 2000 Company Affiliates Franchised Licensed Total
United States
KFC 1,339 – 3,978 47 5,364
Pizza Hut 1,801 – 4,888 1,238 7,927
Taco Bell 1,162 – 3,996 1,588 6,746
Total U.S. 4,302 – 12,862 2,873 20,037
International
KFC 1,109 1,022 3,790 53 5,974
Pizza Hut 668 819 2,466 204 4,157
Taco Bell 44 3 169 33 249
Total International 1,821 1,844 6,425 290 10,380
Total 6,123 1,844 19,287 3,163 30,417
5-year
Year-end 1996-2000 2000 1999 1998 1997 1996 growth
KFC 5,364 5,231 5,105 5,092 5,078 1%
Pizza Hut 7,927 8,084 8,412 8,640 8,696 (2)%
Taco Bell 6,746 6,879 6,852 6,741 6,642 2%
Total U.S. 20,037 20,194 20,369 20,473 20,416 –
KFC 5,974 5,595 5,318 5,145 4,783 6%
Pizza Hut 4,157 3,961 3,873 3,894 3,694 4%
Taco Bell 249 232 203 200 203 5%
Total International 10,380 9,788 9,394 9,239 8,680 5%
Total 30,417 29,982 29,763 29,712 29,096 2%
(a) Compound annual growth rate
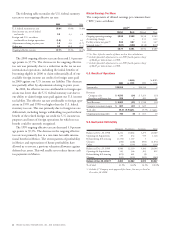
Worldwide Units
In thousands, year-end 2000
Tricon
30
McDonald’s
29
Subway
Burger King
Wendy’s
Domino’s Pizza
Dairy Queen
15
11
776
Tricon Facts
(a)