Pizza Hut 2000 Annual Report Download - page 43
Download and view the complete annual report
Please find page 43 of the 2000 Pizza Hut annual report below. You can navigate through the pages in the report by either clicking on the pages listed below, or by using the keyword search tool below to find specific information within the annual report.-
 1
1 -
2
-
3
-
4
-
5
-
6
-
7
-
8
-
9
-
10
-
11
-
12
-
13
-
14
-
15
-
16
-
17
-
18
-
19
-
20
-
21
-
22
-
23
-
24
-
25
-
26
-
27
-
28
-
29
-
30
-
31
-
32
-
 33
33 -
 34
34 -
 35
35 -
 36
36 -
 37
37 -
 38
38 -
 39
39 -
 40
40 -
 41
41 -
 42
42 -
 43
43 -
 44
44 -
 45
45 -
 46
46 -
 47
47 -
 48
48 -
 49
49 -
 50
50 -
 51
51 -
 52
52 -
 53
53 -
54
-
55
-
56
-
57
-
58
-
59
-
60
-
61
-
62
-
63
-
64
-
65
-
66
-
67
-
68
-
69
-
70
-
71
-
72
 |
 |

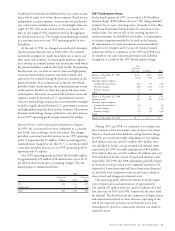
TRICON GLOBAL RESTAURANTS, INC. AND SUBSIDIARIES 41
(in millions) 2000 1999 1998
Cash Flows – Operating Activities
Net income $«413 $««««627 $««««445
Adjustments to reconcile net income to net cash
provided by operating activities:
Depreciation and amortization 354 386 417
Facility actions net gain (176) (381) (275)
Unusual items 120 45 15
Other liabilities and deferred credits (5) 65 58
Deferred income taxes (51) (16) 3
Other non-cash charges and credits, net 43 66 117
Changes in operating working capital, excluding
effects of acquisitions and dispositions:
Accounts and notes receivable (161) (28) (8)
Inventories 11 64
Prepaid expenses and other current assets (3) (13) (20)
Accounts payable and other current liabilities (94) (215) 10
Income taxes payable 40 23 (92)
Net change in operating working capital (207) (227) (106)
Net Cash Provided by Operating Activities 491 565 674
Cash Flows – Investing Activities
Capital spending (572) (470) (460)
Proceeds from refranchising of restaurants 381 916 784
Acquisition of restaurants (24) (6) –
AmeriServe Funding, net (70) ––
Short-term investments (21) 39 (57)
Sales of property, plant and equipment 64 51 58
Other, net 5(8) (23)
Net Cash (Used in) Provided by Investing Activities (237) 522 302
Cash Flows – Financing Activities
Proceeds from Notes –– 604
Revolving Credit Facility activity, by original maturity
More than three months – proceeds –– 400
More than three months – payments –– (900)
Three months or less, net 82 (860) (120)
Proceeds from long-term debt –44
Payments of long-term debt (99) (180) (1,068)
Short-term borrowings – three months or less, net (11) 21 (53)
Repurchase shares of common stock (216) (134) –
Other, net 37 30 13
Net Cash Used in Financing Activities (207) (1,119) (1,120)
Effect of Exchange Rate Changes on Cash and Cash Equivalents (3) –(3)
Net Increase (Decrease) in Cash and Cash Equivalents 44 (32) (147)
Cash and Cash Equivalents – Beginning of Year 89 121 268
Cash and Cash Equivalents – End of Year $«133 $÷÷÷89 $÷÷121
Supplemental Cash Flow Information
Interest paid $«194 $÷÷212 $÷÷303
Income taxes paid 252 340 310
Significant Non-Cash Investing and Financing Activities
Issuance of promissory note to acquire an unconsolidated affiliate $«««25 ––
Contribution of non-cash net assets to an unconsolidated affiliate 67 ––
See accompanying Notes to Consolidated Financial Statements.
Consolidated Statements of Cash Flows
Fiscal years ended December 30, 2000, December 25, 1999 and December 26, 1998