Pizza Hut 2000 Annual Report Download - page 31
Download and view the complete annual report
Please find page 31 of the 2000 Pizza Hut annual report below. You can navigate through the pages in the report by either clicking on the pages listed below, or by using the keyword search tool below to find specific information within the annual report.-
 1
1 -
2
-
3
-
4
-
5
-
6
-
7
-
8
-
9
-
10
-
11
-
12
-
13
-
14
-
15
-
16
-
17
-
18
-
19
-
20
-
 21
21 -
 22
22 -
 23
23 -
 24
24 -
 25
25 -
 26
26 -
 27
27 -
 28
28 -
 29
29 -
 30
30 -
 31
31 -
 32
32 -
 33
33 -
 34
34 -
 35
35 -
 36
36 -
 37
37 -
 38
38 -
 39
39 -
 40
40 -
 41
41 -
42
-
43
-
44
-
45
-
46
-
47
-
48
-
49
-
50
-
51
-
52
-
53
-
54
-
55
-
56
-
57
-
58
-
59
-
60
-
61
-
62
-
63
-
64
-
65
-
66
-
67
-
68
-
69
-
70
-
71
-
72
 |
 |

TRICON GLOBAL RESTAURANTS, INC. AND SUBSIDIARIES 29
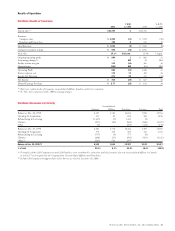
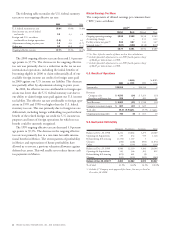
Results of Operations
Worldwide Results of Operations
% B(W) % B(W)
2000 vs. 1999 1999 vs. 1998
System sales(a) $22,159 2 $21,762 6
Revenues
Company sales $÷6,305 (11) $÷7,099 (10)
Franchise and license fees 788 9 723 15
Total Revenues $÷7,093 (9) $÷7,822 (8)
Company restaurant margin $÷÷«954 (13) $÷1,091 3
% of sales 15.1% (0.3) «ppts. 15.4% 1.9 ppts.
Ongoing operating profit $÷÷«888 1 $÷÷«881 15
Accounting changes(b) –NM 29 NM
Facility actions net gain 176 (54) 381 38
Unusual items (204) NM (51) NM
Operating Profit 860 (31) 1,240 21
Interest expense, net 176 13 202 26
Income Tax Provision 271 34 411 (32)
Net Income $÷÷«413 (34) $÷÷«627 41
Diluted Earnings Per Share $÷÷2.77 (29) $÷÷3.92 38
(a) Represents combined sales of Company, unconsolidated affiliate, franchise and license restaurants.
(b) See Note 5 for a discussion of the 1999 accounting changes.
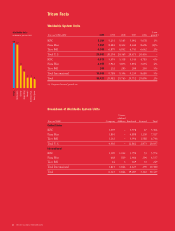
Worldwide Restaurant Unit Activity
Unconsolidated
Company Affiliates Franchisees Licensees Total
Balance at Dec. 26, 1998 8,397 1,120 16,650 3,596 29,763
Openings & Acquisitions 323 83 858 586 1,850
Refranchising & Licensing (1,435) (5) 1,443 (3) –
Closures (301) (20) (434) (646) (1,401)
Other (3) – (103) (124) (230)
Balance at Dec. 25, 1999 6,981 1,178 18,414 3,409 29,982
Openings & Acquisitions 370 108 960 324 1,762
Refranchising & Licensing (757) (9) 775 (9) –
Closures (208) (53) (505) (561) (1,327)
Other(a) (263) 620 (357) ––
Balance at Dec. 30, 2000 (b) 6,123 1,844 19,287 3,163 30,417
% of total 20.1% 6.1% 63.4% 10.4% 100.0%
(a) Primarily includes 320 Company units and 329 Franchisee units contributed in connection with the formation of a new unconsolidated affiliate in Canada
as well as 57 units acquired by the Company from Unconsolidated Affiliates and Franchisees.
(b) Includes 38 Company units approved for closure but not yet closed at December 30, 2000.