Pizza Hut 2000 Annual Report Download - page 34
Download and view the complete annual report
Please find page 34 of the 2000 Pizza Hut annual report below. You can navigate through the pages in the report by either clicking on the pages listed below, or by using the keyword search tool below to find specific information within the annual report.-
 1
1 -
2
-
3
-
4
-
5
-
6
-
7
-
8
-
9
-
10
-
11
-
12
-
13
-
14
-
15
-
16
-
17
-
18
-
19
-
20
-
21
-
22
-
23
-
 24
24 -
 25
25 -
 26
26 -
 27
27 -
 28
28 -
 29
29 -
 30
30 -
 31
31 -
 32
32 -
 33
33 -
 34
34 -
 35
35 -
 36
36 -
 37
37 -
 38
38 -
 39
39 -
 40
40 -
 41
41 -
 42
42 -
 43
43 -
 44
44 -
45
-
46
-
47
-
48
-
49
-
50
-
51
-
52
-
53
-
54
-
55
-
56
-
57
-
58
-
59
-
60
-
61
-
62
-
63
-
64
-
65
-
66
-
67
-
68
-
69
-
70
-
71
-
72
 |
 |

32 TRICON GLOBAL RESTAURANTS, INC. AND SUBSIDIARIES
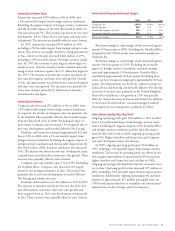
The following table reconciles the U.S. federal statutory
tax rate to our ongoing effective tax rate:
2000 1999 1998
U.S. federal statutory tax rate 35.0% 35.0% 35.0%
State income tax, net of federal
tax benefit 2.2 2.3 2.8
Foreign and U.S. tax effects
attributable to foreign operations (1.0) 1.5 6.3
Adjustments relating to prior years 1.3 0.8 (1.7)
Other, net 0.2 (0.3) (0.1)
Ongoing effective tax rate 37.7% 39.3% 42.3%
The 2000 ongoing effective tax rate decreased 1.6 percent-
age points to 37.7%. The decrease in the ongoing effective
tax rate was primarily due to a reduction in the tax on our
international operations, including the initial benefits of
becoming eligible in 2000 to claim substantially all of our
available foreign income tax credits for foreign taxes paid
in 2000 against our U.S. income tax liability. This decrease
was partially offset by adjustments relating to prior years.
In 2000, the effective tax rate attributable to foreign oper-
ations was lower than the U.S. federal statutory rate due to
our ability to claim foreign taxes paid against our U.S. income
tax liability. The effective tax rate attributable to foreign oper-
ations in 1999 and 1998 was higher than the U.S. federal
statutory tax rate. This was primarily due to foreign tax rate
differentials, including foreign withholding tax paid without
benefit of the related foreign tax credit for U.S. income tax
purposes and losses of foreign operations for which no tax
benefit could be currently recognized.
The 1999 ongoing effective tax rate decreased 3.0 percent-
age points to 39.3%. The decrease in the ongoing effective
tax rate was primarily due to a one-time favorable interna-
tional benefit in Mexico. The recent pattern of profitability
in Mexico and expectations of future profitability have
allowed us to reverse a previous valuation allowance against
deferred tax assets. This will enable us to reduce future cash
tax payments in Mexico.
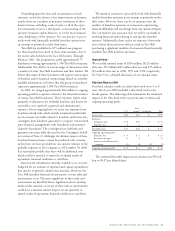
Diluted Earnings Per Share
The components of diluted earnings per common share
(“EPS”) were as follows:
2000(a) 1999(a)
Diluted Basic Diluted Basic
Ongoing operating earnings $2.98 $3.02 $2.58 $2.69
Accounting changes ––0.11 0.12
Facility actions net gain (b) 0.66 0.67 1.41 1.47
Unusual items(c) (0.87) (0.88) (0.18) (0.19)
Total $2.77 $2.81 $3.92 $4.09
(a) See Note 4 for the number of shares used in these calculations.
(b) Includes favorable adjustments to our 1997 fourth quarter charge
of $0.06 per diluted share in 1999.
(c) Includes favorable adjustments to our 1997 fourth quarter charge
of $0.07 per diluted share in 1999.
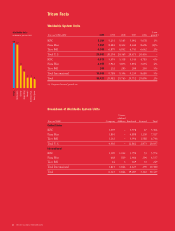
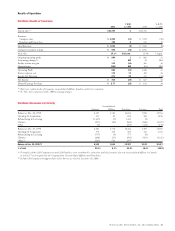
U.S. Results of Operations
% B(W) % B(W)
2000 vs. 1999 1999 vs. 1998
System sales $14,514 – $14,516 4
Revenues
Company sales $÷4,533 (14) $÷5,253 (13)
Franchise and license fees 529 7 495 16
Total Revenues $÷5,062 (12) $÷5,748 (11)
Company restaurant margin $÷÷«687 (17) $÷÷«825 1
% of sales 15.2% (0.5) «ppts. 15.7% 2.1 ppts.
Ongoing operating profit $÷÷«742 (9) $÷÷«813 10
U.S. Restaurant Unit Activity
Company Franchisees Licensees Total
Balance at Dec. 26, 1998 6,232 10,862 3,275 20,369
Openings & Acquisitions 155 432 539 1,126
Refranchising & Licensing (1,170) 1,167 3 –
Closures (230) (248) (593) (1,071)
Other (3) (103) (124) (230)
Balance at Dec. 25, 1999 4,984 12,110 3,100 20,194
Openings & Acquisitions 143 366 303 812
Refranchising & Licensing (672) 681 (9) –
Closures (153) (295) (521) (969)
Balance at Dec. 30, 2000 (a) 4,302 12,862 2,873 20,037
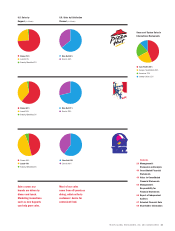
% of total 21.5% 64.2% 14.3% 100.0%
(a) Includes 37 Company units approved for closure, but not yet closed at
December 30, 2000.