Pizza Hut 2000 Annual Report Download - page 36
Download and view the complete annual report
Please find page 36 of the 2000 Pizza Hut annual report below. You can navigate through the pages in the report by either clicking on the pages listed below, or by using the keyword search tool below to find specific information within the annual report.-
 1
1 -
2
-
3
-
4
-
5
-
6
-
7
-
8
-
9
-
10
-
11
-
12
-
13
-
14
-
15
-
16
-
17
-
18
-
19
-
20
-
21
-
22
-
23
-
24
-
25
-
 26
26 -
 27
27 -
 28
28 -
 29
29 -
 30
30 -
 31
31 -
 32
32 -
 33
33 -
 34
34 -
 35
35 -
 36
36 -
 37
37 -
 38
38 -
 39
39 -
 40
40 -
 41
41 -
 42
42 -
 43
43 -
 44
44 -
 45
45 -
 46
46 -
47
-
48
-
49
-
50
-
51
-
52
-
53
-
54
-
55
-
56
-
57
-
58
-
59
-
60
-
61
-
62
-
63
-
64
-
65
-
66
-
67
-
68
-
69
-
70
-
71
-
72
 |
 |

34 TRICON GLOBAL RESTAURANTS, INC. AND SUBSIDIARIES
attributable to favorable Effective Net Pricing. Labor cost
increases, primarily driven by higher wage rates, were almost
fully offset by lower food and paper costs as improved prod-
uct cost management resulted in lower overall beverage and
distribution costs. The improvement also included approxi-
mately 15 basis points from retroactive beverage rebates
related to 1998 recognized in 1999. In addition, an increase
in favorable insurance-related adjustments over 1998 con-
tributed approximately 10 basis points to our improvement.
See Note 21 for additional information regarding our insur-
ance-related adjustments. All of these improvements were
partially offset by volume declines at Taco Bell and the unfa-
vorable impact of the introduction of lower margin chicken
sandwiches at KFC.
U.S. Ongoing Operating Profit
Ongoing operating profit declined $71 million or 9% in
2000. Excluding the negative impact of the Portfolio Effect
and the favorable impact from the fifty-third week in 2000,
ongoing operating profit decreased approximately 6%. The
decrease was primarily due to a 100 basis point decline in
base restaurant margin and lower franchise and license fees
(excluding the Portfolio Effect), partially offset by reduced
G&A. The decrease in G&A was largely due to lower incentive
compensation, decreased professional fees and lower spending
at Pizza Hut and Taco Bell on conferences. The G&A declines
were partially offset by higher franchise-related expenses,
primarily allowances for doubtful franchise and license fee
receivables, as more fully discussed in the Franchisee Financial
Condition section.
In 1999, ongoing operating profit increased $73 million or
10%. Excluding the negative impact of the Portfolio Effect,
ongoing operating profit increased 15%. The increase was due
to base restaurant margin improvement of 140 basis points
and higher franchise fees primarily from new unit development,
partially offset by higher G&A, net of field G&A savings from
the Portfolio Effect. This increase in G&A was largely due to
higher spending on conferences at Pizza Hut and Taco Bell.
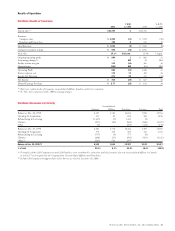
International Results of Operations
% B(W) % B(W)
2000 vs. 1999 1999 vs. 1998
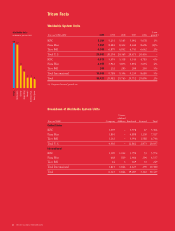
System sales $7,645 6 $7,246 10
Revenues
Company sales $1,772 (4) $1,846 –
Franchise and license fees 259 14 228 13
Total Revenues $2,031 (2) $2,074 2
Company restaurant margin $÷«267 – $÷«266 11
% of sales 15.1% 0.7«ppts. 14.4% 1.4«ppts.
Ongoing operating profit $÷«309 16 $÷«265 39
International Restaurant Unit Activity
Unconsolidated
Company Affiliates Franchisees Licensees Total
Balance at Dec. 26, 1998 2,165 1,120 5,788 321 9,394
Openings & Acquisitions 168 83 426 47 724
Refranchising & Licensing (265) (5) 276 (6) –
Closures (71) (20) (186) (53) (330)
Balance at Dec. 25, 1999 1,997 1,178 6,304 309 9,788
Openings 227 108 594 21 950
Refranchising & Licensing (85) (9) 94––
Closures (55) (53) (210) (40) (358)
Other(a) (263) 620 (357) ––
Balance at Dec. 30, 2000 (b) 1,821 1,844 6,425 290 10,380
% of total 17.5% 17.8% 61.9% 2.8% 100.0%
(a) Primarily includes 320 Company units and 329 Franchisee units contributed in connection with the formation of a new unconsolidated affiliate in Canada
as well as 57 units acquired by the Company from Unconsolidated Affiliates and Franchisees.
(b) Includes 1 Company unit approved for closure, but not yet closed at December 30, 2000.