Pizza Hut 2000 Annual Report Download - page 30
Download and view the complete annual report
Please find page 30 of the 2000 Pizza Hut annual report below. You can navigate through the pages in the report by either clicking on the pages listed below, or by using the keyword search tool below to find specific information within the annual report.-
 1
1 -
2
-
3
-
4
-
5
-
6
-
7
-
8
-
9
-
10
-
11
-
12
-
13
-
14
-
15
-
16
-
17
-
18
-
19
-
 20
20 -
 21
21 -
 22
22 -
 23
23 -
 24
24 -
 25
25 -
 26
26 -
 27
27 -
 28
28 -
 29
29 -
 30
30 -
 31
31 -
 32
32 -
 33
33 -
 34
34 -
 35
35 -
 36
36 -
 37
37 -
 38
38 -
 39
39 -
 40
40 -
41
-
42
-
43
-
44
-
45
-
46
-
47
-
48
-
49
-
50
-
51
-
52
-
53
-
54
-
55
-
56
-
57
-
58
-
59
-
60
-
61
-
62
-
63
-
64
-
65
-
66
-
67
-
68
-
69
-
70
-
71
-
72
 |
 |

28 TRICON GLOBAL RESTAURANTS, INC. AND SUBSIDIARIES
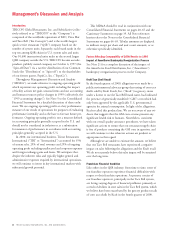
Store Portfolio Strategy
Beginning in 1995, we have been strategically reducing our
share of total system units by selling Company restaurants to
existing and new franchisees where their expertise can generally
be leveraged to improve our overall operating performance,
while retaining Company ownership of key U.S. and Inter-
national markets. This portfolio-balancing activity has reduced,
and will continue to reduce, our reported revenues and restau-
rant profits and has increased the importance of system sales
as a key performance measure. We expect to substantially
complete our refranchising program in 2001.
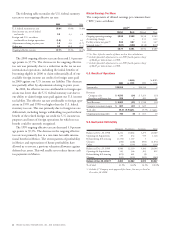
The following table summarizes our refranchising activi-
ties for the last three years:
2000 1999 1998
Number of units refranchised 757 1,435 1,373
Refranchising proceeds, pre-tax $381 $«««916 $«««784
Refranchising net gains, pre-tax $200 $«««422 $«««279
In addition to our refranchising program, we have been
closing restaurants over the past several years. Restaurants
closed include poor performing restaurants, restaurants that
are relocated to a new site within the same trade area or U.S.
Pizza Hut delivery units consolidated with a new or existing
dine-in traditional store within the same trade area.
The following table summarizes Company store closure
activities for the last three years:
2000 1999 1998
Number of units closed 208 301 572
Store closure costs (credits) (a) $««10 $««13 $«(27)
Impairment charges for stores to be
closed in the future $««÷6 $««12 $«÷«6
(a) Includes favorable adjustments to our 1997 fourth quarter charge of
$9 million in 1999 and $56 million in 1998.
The impact on ongoing operating profit arising from our
refranchising and store closure initiatives as well as the contri-
bution of Company stores to a new unconsolidated affiliate
as described in the Impact of New Unconsolidated Affiliates
section (the “Portfolio Effect”), represents the net of (a) the
estimated reduction in Company sales, restaurant margin
and general and administrative expenses (“G&A”), (b) the
estimated increase in franchise fees and (c) the equity income
(loss) from investments in unconsolidated affiliates (“equity
income”). The amounts presented below reflect the estimated
impact from stores that were operated by us for all or some
portion of the comparable period in the respective previous
year and were no longer operated by us as of the last day of
the respective year.
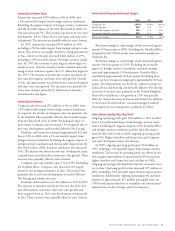
The following table summarizes the estimated revenue
impact of the Portfolio Effect:
2000
U.S. International Worldwide
Reduced sales $«««(838) $(246) $(1,084)
Increased franchise fees 39 13 52
Reduction in total revenues $«««(799) $(233) $(1,032)
1999
U.S. International Worldwide
Reduced sales $(1,065) $(201) $(1,266)
Increased franchise fees 51 9 60
Reduction in total revenues $(1,014) $(192) $(1,206)
The following table summarizes the estimated impact on
ongoing operating profit of the Portfolio Effect:
2000
U.S. International Worldwide
Decreased restaurant margin $««(90) $(25) $(115)
Increased franchise fees 39 13 52
Decreased G&A 11 6 17
Equity income (loss) – (1) (1)
(Decrease) in ongoing operating profit $««(40) $÷(7) $÷(47)
1999
U.S. International Worldwide
Decreased restaurant margin $(108) $(18) $(126)
Increased franchise fees 51 9 60
Decreased G&A 17 10 27
(Decrease) increase in ongoing
operating profit $÷(40) $÷«1 $÷(39)
The estimated interest savings resulting from the reduction
of average debt with the net after-tax cash proceeds from our
refranchising activities largely mitigated the above reduction
in ongoing operating profit.