Pizza Hut 2000 Annual Report Download - page 33
Download and view the complete annual report
Please find page 33 of the 2000 Pizza Hut annual report below. You can navigate through the pages in the report by either clicking on the pages listed below, or by using the keyword search tool below to find specific information within the annual report.-
 1
1 -
2
-
3
-
4
-
5
-
6
-
7
-
8
-
9
-
10
-
11
-
12
-
13
-
14
-
15
-
16
-
17
-
18
-
19
-
20
-
21
-
22
-
 23
23 -
 24
24 -
 25
25 -
 26
26 -
 27
27 -
 28
28 -
 29
29 -
 30
30 -
 31
31 -
 32
32 -
 33
33 -
 34
34 -
 35
35 -
 36
36 -
 37
37 -
 38
38 -
 39
39 -
 40
40 -
 41
41 -
 42
42 -
 43
43 -
44
-
45
-
46
-
47
-
48
-
49
-
50
-
51
-
52
-
53
-
54
-
55
-
56
-
57
-
58
-
59
-
60
-
61
-
62
-
63
-
64
-
65
-
66
-
67
-
68
-
69
-
70
-
71
-
72
 |
 |

TRICON GLOBAL RESTAURANTS, INC. AND SUBSIDIARIES 31
Worldwide Other (Income) Expense
2000 1999 1998
Equity income $(25) $(19) $(18)
Foreign exchange net loss (gain) –3(6)
Other (income) expense $(25) $(16) $(24)
Other (income) expense increased $9 million or 55% in
2000. The increase in equity income was primarily due to
improved results of our unconsolidated affiliates in Japan, the
United Kingdom and China.
In 1999, other (income) expense declined $8 million or
31%. The decline was primarily due to foreign exchange losses
in 1999 versus gains in 1998 related to U.S. dollar denomi-
nated short-term investments in Canada.
Worldwide Facility Actions Net Gain
We recorded facility actions net gain of $176 million in 2000,
$381 million in 1999 and $275 million in 1998. See the Store
Portfolio Strategy section for more details regarding our refran-
chising and closure activities and Note 5 for a summary of the
components of facility actions net gain by operating segment.
Impairment charges for stores that will continue to be
used in the business were $8 million in 2000 compared to
$16 million in 1999 and $25 million in 1998 reflecting fewer
underperforming stores. As a result of the adoption of the
SEC’s interpretation of Statement of Financial Accounting
Standards No. 121 “Accounting for the Impairment of Long-
Lived Assets” (“SFAS 121”) in 1998, we perform impairment
evaluations when we expect to actually close a store beyond
the quarter in which our closure decision is made. This change
resulted in additional impairment charges of $6 million in
2000, $12 million in 1999 and $6 million in 1998. Under
our prior accounting policy, these impairment charges would
have been included in store closure costs in the quarter in
which the closure decision was made.
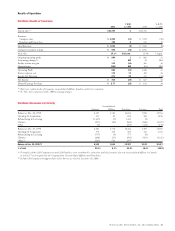
Worldwide Ongoing Operating Profit
% B(W) % B(W)
2000 vs. 1999 1999 vs. 1998
U.S. ongoing operating
profit $«742 (9) $÷«813 10
International ongoing
operating profit 309 16 265 39
Foreign exchange net loss –NM (3) NM
Ongoing unallocated and
corporate expenses (163) 16 (194) (14)
Ongoing operating profit $«888 1 $881 15
The changes in U.S. and International ongoing operating
profit for 2000 and 1999 are discussed in the respective
sections below.
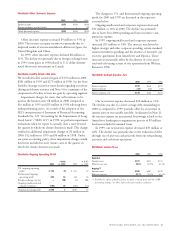
Ongoing unallocated and corporate expenses decreased
$31 million or 16% in 2000. The decline was primarily
due to lower Year 2000 spending and lower incentive com-
pensation expense.
In 1999, ongoing unallocated and corporate expenses
increased $25 million or 14%. The increase was driven by
higher strategic and other corporate spending, system standard-
ization investment spending and the absence of favorable cost
recovery agreements from AmeriServe and PepsiCo. These
increases were partially offset by the absence of costs associ-
ated with relocating certain of our operations from Wichita,
Kansas in 1998.
Worldwide Interest Expense, Net
2000 1999 1998
Interest expense $190 $218 $291
Interest income (14) (16) (19)
Interest expense, net $176 $202 $272
Our net interest expense decreased $26 million or 13%.
The decline was due to a lower average debt outstanding in
2000 as compared to 1999, partially offset by an increase in
interest rates on our variable rate debt. As discussed in Note 21,
the interest expense on incremental borrowings related to the
AmeriServe bankruptcy reorganization process of $9 million
has been included in unusual items.
In 1999, our net interest expense decreased $70 million or
26%. The decline was primarily due to the reduction of debt
through use of after-tax cash proceeds from our refranchising
activities and cash from operations.
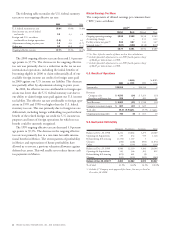
Worldwide Income Taxes
2000 1999 1998
Reported
Income taxes $271 $411 $311
Effective tax rate 39.6% 39.5% 41.1%
Ongoing (a)
Income taxes $268 $267 $210
Effective tax rate 37.7% 39.3% 42.3%
(a) Excludes the effects of facility actions net gain, unusual items and the 1999
accounting changes. See Note 5 for a discussion of these exclusions.