Pizza Hut 2000 Annual Report Download - page 27
Download and view the complete annual report
Please find page 27 of the 2000 Pizza Hut annual report below. You can navigate through the pages in the report by either clicking on the pages listed below, or by using the keyword search tool below to find specific information within the annual report.-
 1
1 -
2
-
3
-
4
-
5
-
6
-
7
-
8
-
9
-
10
-
11
-
12
-
13
-
14
-
15
-
16
-
 17
17 -
 18
18 -
 19
19 -
 20
20 -
 21
21 -
 22
22 -
 23
23 -
 24
24 -
 25
25 -
 26
26 -
 27
27 -
 28
28 -
 29
29 -
 30
30 -
 31
31 -
 32
32 -
 33
33 -
 34
34 -
 35
35 -
 36
36 -
 37
37 -
38
-
39
-
40
-
41
-
42
-
43
-
44
-
45
-
46
-
47
-
48
-
49
-
50
-
51
-
52
-
53
-
54
-
55
-
56
-
57
-
58
-
59
-
60
-
61
-
62
-
63
-
64
-
65
-
66
-
67
-
68
-
69
-
70
-
71
-
72
 |
 |

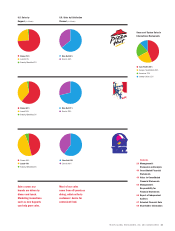
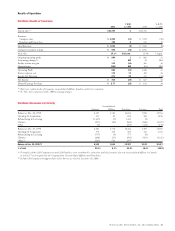
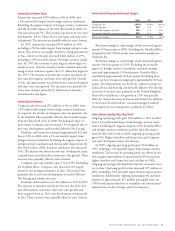
TRICON GLOBAL RESTAURANTS, INC. AND SUBSIDIARIES 25
Asia-Pacific 44%
Europe, South Africa 23%
Americas 21%
Greater China 12%
Sources of System Sales in
International Restaurants
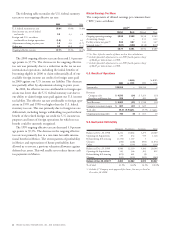
Dinner 74%
Lunch 24%
Snacks/Breakfast 2%
U.S. Sales by
Daypart (% of Sales)
U.S. Sales by Distribution
Channel (% of Sales)
Dine Out 64%
Dine In 36%
Dinner 61%
Lunch 36%
Snacks/Breakfast 3%
Dine Out 71%
Dine In 29%
Dinner 46%
Lunch 48%
Snacks/Breakfast 6%
Dine Out 60%
Dine In 40%
Sales across our
brands are driven by
dinner and lunch.
Marketing innovations
such as new dayparts
can help grow sales.
Most of our sales
come from off-premises
dining, which reflects
customers’ desire for
convenient food.
TM
®
®
Contents
26 Management’s
Discussion and Analysis
40 Consolidated Financial
Statements
44 Notes to Consolidated
Financial Statements
66 Management’s
Responsibility for
Financial Statements
66 Report of Independent
Auditors
67 Selected Financial Data
68 Shareholder Information