Pizza Hut 2000 Annual Report Download - page 57
Download and view the complete annual report
Please find page 57 of the 2000 Pizza Hut annual report below. You can navigate through the pages in the report by either clicking on the pages listed below, or by using the keyword search tool below to find specific information within the annual report.-
 1
1 -
2
-
3
-
4
-
5
-
6
-
7
-
8
-
9
-
10
-
11
-
12
-
13
-
14
-
15
-
16
-
17
-
18
-
19
-
20
-
21
-
22
-
23
-
24
-
25
-
26
-
27
-
28
-
29
-
30
-
31
-
32
-
33
-
34
-
35
-
36
-
37
-
38
-
39
-
40
-
41
-
42
-
43
-
44
-
45
-
46
-
 47
47 -
 48
48 -
 49
49 -
 50
50 -
 51
51 -
 52
52 -
 53
53 -
 54
54 -
 55
55 -
 56
56 -
 57
57 -
 58
58 -
 59
59 -
 60
60 -
 61
61 -
 62
62 -
 63
63 -
 64
64 -
 65
65 -
 66
66 -
 67
67 -
68
-
69
-
70
-
71
-
72
 |
 |

TRICON GLOBAL RESTAURANTS, INC. AND SUBSIDIARIES 55
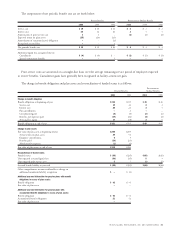
The components of net periodic benefit cost are set forth below:
Pension Benefits Postretirement Medical Benefits
2000 1999 1998 2000 1999 1998
Service cost $«19 $«20 $«21 $÷«2 $÷«2 $÷«2
Interest cost 24 22 20 333
Amortization of prior service cost 11–(1) (2) (2)
Expected return on plan assets (25) (24) (21)
Amortization of transition (asset) obligation ––(2)
Recognized actuarial loss ––2
Net periodic benefit cost $«19 $«19 $«20 $÷«4 $÷«3 $÷«3
Additional (gain) loss recognized due to:
Curtailment $÷(4) $÷(4) $÷«– $÷(1) $÷(1) $÷(3)
Special termination benefits ––3––1
Prior service costs are amortized on a straight-line basis over the average remaining service period of employees expected
to receive benefits. Curtailment gains have generally been recognized in facility actions net gain.
The change in benefit obligation and plan assets and reconciliation of funded status is as follows:
Postretirement
Pension Benefits Medical Benefits
2000 1999 2000 1999
Change in benefit obligation
Benefit obligation at beginning of year $315 $315 $«45 $«38
Service cost 19 20 22
Interest cost 24 22 33
Plan amendments –6––
Curtailment (gain) (5) (5) (2) (1)
Benefits and expenses paid (19) (24) (3) (2)
Actuarial loss (gain) 17 (19) 35
Benefit obligation at end of year $351 $315 $«48 $«45
Change in plan assets
Fair value of plan assets at beginning of year $290 $259
Actual return on plan assets 39 51
Employer contributions 45
Benefits paid (19) (23)
Administrative expenses (1) (2)
Fair value of plan assets at end of year $313 $290
Reconciliation of funded status
Funded status $«(38) $«(25) $(48) $(45)
Unrecognized actuarial (gain) loss (30) (35) 53
Unrecognized prior service costs 57(1) (2)
Accrued benefit liability at year-end $«(63) $«(53) $(44) $(44)
Other comprehensive income attributable to change in
additional minimum liability recognition $÷÷– $÷«(3)
Additional year-end information for pension plans with benefit
obligations in excess of plan assets:
Benefit obligation $÷42 $÷31
Fair value of plan assets ––
Additional year-end information for pension plans with
accumulated benefit obligations in excess of plan assets:
Benefit obligation $÷42 $÷31
Accumulated benefit obligation 21 12
Fair value of plan assets ––