Pizza Hut 2000 Annual Report Download - page 44
Download and view the complete annual report
Please find page 44 of the 2000 Pizza Hut annual report below. You can navigate through the pages in the report by either clicking on the pages listed below, or by using the keyword search tool below to find specific information within the annual report.-
 1
1 -
2
-
3
-
4
-
5
-
6
-
7
-
8
-
9
-
10
-
11
-
12
-
13
-
14
-
15
-
16
-
17
-
18
-
19
-
20
-
21
-
22
-
23
-
24
-
25
-
26
-
27
-
28
-
29
-
30
-
31
-
32
-
33
-
 34
34 -
 35
35 -
 36
36 -
 37
37 -
 38
38 -
 39
39 -
 40
40 -
 41
41 -
 42
42 -
 43
43 -
 44
44 -
 45
45 -
 46
46 -
 47
47 -
 48
48 -
 49
49 -
 50
50 -
 51
51 -
 52
52 -
 53
53 -
 54
54 -
55
-
56
-
57
-
58
-
59
-
60
-
61
-
62
-
63
-
64
-
65
-
66
-
67
-
68
-
69
-
70
-
71
-
72
 |
 |

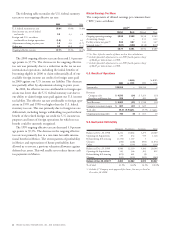
42 TRICON GLOBAL RESTAURANTS, INC. AND SUBSIDIARIES
(in millions) 2000 1999
ASSETS
Current Assets
Cash and cash equivalents $÷÷133 $÷÷÷89
Short-term investments, at cost 63 48
Accounts and notes receivable, less allowance: $82 in 2000 and $13 in 1999 302 161
Inventories 47 61
Prepaid expenses and other current assets 68 68
Deferred income tax assets 75 59
Total Current Assets 688 486
Property, Plant and Equipment, net 2,540 2,531
Intangible Assets, net 419 527
Investments in Unconsolidated Affiliates 257 170
Other Assets 245 247
Total Assets $«4,149 $«3,961
LIABILITIES AND SHAREHOLDERS’ DEFICIT
Current Liabilities
Accounts payable and other current liabilities $÷÷978 $«1,085
Income taxes payable 148 96
Short-term borrowings 90 117
Total Current Liabilities 1,216 1,298
Long-term Debt 2,397 2,391
Other Liabilities and Deferred Credits 848 825
Deferred Income Taxes 10 7
Total Liabilities 4,471 4,521
Shareholders’ Deficit
Preferred stock, no par value, 250 shares authorized; no shares issued ––
Common stock, no par value, 750 shares authorized; 147 and 151 shares issued
in 2000 and 1999, respectively 1,133 1,264
Accumulated deficit (1,278) (1,691)
Accumulated other comprehensive income (177) (133)
Total Shareholders’ Deficit (322) (560)
Total Liabilities and Shareholders’ Deficit $«4,149 $«3,961
See accompanying Notes to Consolidated Financial Statements.
Consolidated Balance Sheets
December 30, 2000 and December 25, 1999