Pitney Bowes 2008 Annual Report Download - page 94
Download and view the complete annual report
Please find page 94 of the 2008 Pitney Bowes annual report below. You can navigate through the pages in the report by either clicking on the pages listed below, or by using the keyword search tool below to find specific information within the annual report.-
 1
1 -
2
-
3
-
4
-
5
-
6
-
7
-
8
-
9
-
10
-
11
-
12
-
13
-
14
-
15
-
16
-
17
-
18
-
19
-
20
-
21
-
22
-
23
-
24
-
25
-
26
-
27
-
28
-
29
-
30
-
31
-
32
-
33
-
34
-
35
-
36
-
37
-
38
-
39
-
40
-
41
-
42
-
43
-
44
-
45
-
46
-
47
-
48
-
49
-
50
-
51
-
52
-
53
-
54
-
55
-
56
-
57
-
58
-
59
-
60
-
61
-
62
-
63
-
64
-
65
-
66
-
67
-
68
-
69
-
70
-
71
-
72
-
73
-
74
-
75
-
76
-
77
-
78
-
79
-
80
-
81
-
82
-
83
-
 84
84 -
 85
85 -
 86
86 -
 87
87 -
 88
88 -
 89
89 -
 90
90 -
 91
91 -
 92
92 -
 93
93 -
 94
94 -
 95
95 -
 96
96 -
 97
97 -
 98
98 -
 99
99 -
 100
100 -
 101
101 -
 102
102 -
 103
103 -
 104
104 -
105
-
106
-
107
-
108
-
109
-
110
-
111
-
112
-
113
-
114
-
115
-
116
-
117
-
118
-
119
-
120
 |
 |

PITNEY BOWES INC.
NOTES TO CONSOLIDATED FINANCIAL STATEMENTS
(Tabular dollars in thousands, except per share data)
75
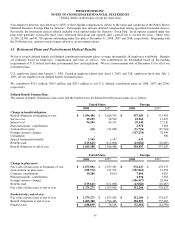
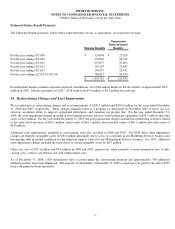
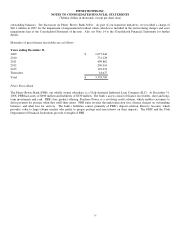
Estimated Future Benefit Payments
The following benefit payments, which reflect expected future service, as appropriate, are expected to be paid:
Pension Benefits
Nonpension
Postretirement
Benefits
For the year ending 12/31/09 $ 124,606 $ 27,029
For the year ending 12/31/10 132,096 26,574
For the year ending 12/31/11 135,077 25,403
For the year ending 12/31/12 143,143 23,983
For the year ending 12/31/13 146,973 22,431
For the years ending 12/31/14-12/31/18 788,815 96,456
$ 1,470,710 $ 221,876
Postretirement benefit payments represent expected contributions, net of the annual Medicare Part D subsidy of approximately $2.8
million in 2009. Subsidy payments for 2010 – 2018 range from $3.0 million to $4.2 million for each year.
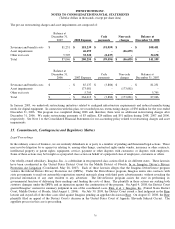
14. Restructuring Charges and Asset Impairments
We recorded pre-tax restructuring charges and asset impairments of $200.3 million and $264.0 million for the years ended December
31, 2008 and 2007, respectively. These charges primarily relate to a program we announced in November 2007 to lower our cost
structure, accelerate efforts to improve operational efficiencies, and transition our product line. For the year ended December 31,
2008, the asset impairment charges included in restructuring activities relate to older technology equipment of $28.5 million and other
assets of $2.2 million. For the year ended December 31, 2007, the asset impairment charges included in restructuring activities related
to the write-off of inventory of $48.1 million, rental assets of $61.5 million, lease residual values of $46.1 million and other assets of
$8.8 million.
Additional asset impairments, unrelated to restructuring, were also recorded in 2008 and 2007. For 2008, these other impairment
charges are related to intangible assets of $16.0 million principally due to a loss of a customer in our Marketing Services business and
the ongoing shift in market conditions for the litigation support vertical in our Management Services business. For 2007, additional
asset impairment charges included the write-down of certain intangible assets for $8.5 million.
Other exit costs of $35.3 million and $5.8 million in 2008 and 2007, respectively, relate primarily to lease termination fees, facility
closing costs, contract cancellation costs and outplacement costs.
As of December 31, 2008, 1,926 terminations have occurred under the restructuring program and approximately 300 additional
unfilled positions have been eliminated. The majority of the liability at December 31, 2008 is expected to be paid by the end of 2009
from cash generated from operations.