Pitney Bowes 2008 Annual Report Download - page 88
Download and view the complete annual report
Please find page 88 of the 2008 Pitney Bowes annual report below. You can navigate through the pages in the report by either clicking on the pages listed below, or by using the keyword search tool below to find specific information within the annual report.-
 1
1 -
2
-
3
-
4
-
5
-
6
-
7
-
8
-
9
-
10
-
11
-
12
-
13
-
14
-
15
-
16
-
17
-
18
-
19
-
20
-
21
-
22
-
23
-
24
-
25
-
26
-
27
-
28
-
29
-
30
-
31
-
32
-
33
-
34
-
35
-
36
-
37
-
38
-
39
-
40
-
41
-
42
-
43
-
44
-
45
-
46
-
47
-
48
-
49
-
50
-
51
-
52
-
53
-
54
-
55
-
56
-
57
-
58
-
59
-
60
-
61
-
62
-
63
-
64
-
65
-
66
-
67
-
68
-
69
-
70
-
71
-
72
-
73
-
74
-
75
-
76
-
77
-
 78
78 -
 79
79 -
 80
80 -
 81
81 -
 82
82 -
 83
83 -
 84
84 -
 85
85 -
 86
86 -
 87
87 -
 88
88 -
 89
89 -
 90
90 -
 91
91 -
 92
92 -
 93
93 -
 94
94 -
 95
95 -
 96
96 -
 97
97 -
 98
98 -
99
-
100
-
101
-
102
-
103
-
104
-
105
-
106
-
107
-
108
-
109
-
110
-
111
-
112
-
113
-
114
-
115
-
116
-
117
-
118
-
119
-
120
 |
 |

PITNEY BOWES INC.
NOTES TO CONSOLIDATED FINANCIAL STATEMENTS
(Tabular dollars in thousands, except per share data)
69
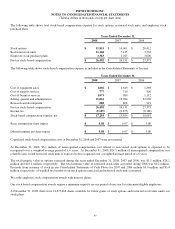
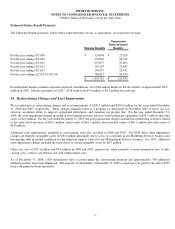
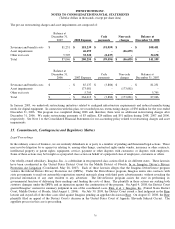
Non-employee directors may defer up to 100% of their eligible compensation, subject to the terms and conditions of the Pitney Bowes
Deferred Incentive Savings Plan for directors. Participants may allocate deferred compensation among specified investment choices.
Previously, the investment choices offered included stock options under the Directors’ Stock Plan. Stock options acquired under this
plan were generally exercisable three years following their grant and expired after a period not to exceed ten years. There were
15,269, 22,091 and 41,716 options outstanding under this plan at December 31, 2008, 2007 and 2006, respectively. Beginning with
the 2004 plan year, options were no longer offered as an investment choice.
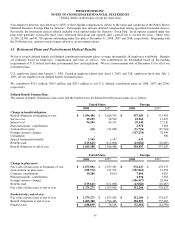
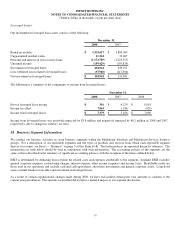
13. Retirement Plans and Postretirement Medical Benefits
We have several defined benefit and defined contribution retirement plans covering substantially all employees worldwide. Benefits
are primarily based on employees’ compensation and years of service. Our contributions are determined based on the funding
requirements of U.S. federal and other governmental laws and regulations. We use a measurement date of December 31 for all of our
retirement plans.
U.S. employees hired after January 1, 2005, Canadian employees hired after April 1, 2005, and U.K. employees hired after July 1,
2005, are not eligible for our defined benefit retirement plans.
We contributed $32.1 million, $30.5 million and $28.1 million to our U.S. defined contribution plans in 2008, 2007 and 2006,
respectively.
Defined Benefit Pension Plans
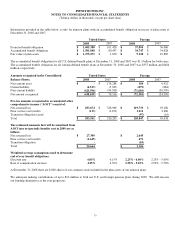
The change in benefit obligations, plan assets and the funded status for defined benefit pension plans are as follows:
United States Foreign
2008 2007 2008 2007
Change in benefit obligation:
Benefit obligation at beginning of year $ 1,596,486 $ 1,624,743 $ 557,185 $ 523,958
Service cost 29,699 28,500 10,562 13,427
Interest cost 96,205 94,173 29,140 27,720
Plan participants’ contributions - - 2,978 3,004
Actuarial loss (gain) 528 (41,049) (75,728) (25,744)
Foreign currency changes - - (117,234) 32,399
Curtailment - - - 906
Special termination benefits 2,105 1,187 632 -
Benefits paid (119,643) (111,068) (23,028) (18,485)
Benefit obligation at end of year $ 1,605,380 $ 1,596,486 $ 384,507 $ 557,185
United States Foreign
2008 2007 2008 2007
Change in plan assets:
Fair value of plan assets at beginning of year $ 1,675,002 $ 1,655,283 $ 532,627 $ 478,375
Actual return on plan assets (390,374) 121,973 (101,822) 31,554
Company contributions 10,286 8,814 7,868 9,615
Plan participants’ contributions - - 2,978 3,004
Foreign currency changes - - (106,417) 28,564
Benefits paid (119,643) (111,068) (23,028) (18,485)
Fair value of plan assets at end of year $ 1,175,271 $ 1,675,002 $ 312,206 $ 532,627
Funded status, end of year:
Fair value of plan assets at end of year $ 1,175,271 $ 1,675,002 $ 312,206 $ 532,627
Benefit obligations at end of year 1,605,380 1,596,486 384,507 557,185
Funded status $ (430,109) $ 78,516 $ (72,301) $ (24,558)