Pitney Bowes 2008 Annual Report Download - page 61
Download and view the complete annual report
Please find page 61 of the 2008 Pitney Bowes annual report below. You can navigate through the pages in the report by either clicking on the pages listed below, or by using the keyword search tool below to find specific information within the annual report.-
 1
1 -
2
-
3
-
4
-
5
-
6
-
7
-
8
-
9
-
10
-
11
-
12
-
13
-
14
-
15
-
16
-
17
-
18
-
19
-
20
-
21
-
22
-
23
-
24
-
25
-
26
-
27
-
28
-
29
-
30
-
31
-
32
-
33
-
34
-
35
-
36
-
37
-
38
-
39
-
40
-
41
-
42
-
43
-
44
-
45
-
46
-
47
-
48
-
49
-
50
-
 51
51 -
 52
52 -
 53
53 -
 54
54 -
 55
55 -
 56
56 -
 57
57 -
 58
58 -
 59
59 -
 60
60 -
 61
61 -
 62
62 -
 63
63 -
 64
64 -
 65
65 -
 66
66 -
 67
67 -
 68
68 -
 69
69 -
 70
70 -
 71
71 -
72
-
73
-
74
-
75
-
76
-
77
-
78
-
79
-
80
-
81
-
82
-
83
-
84
-
85
-
86
-
87
-
88
-
89
-
90
-
91
-
92
-
93
-
94
-
95
-
96
-
97
-
98
-
99
-
100
-
101
-
102
-
103
-
104
-
105
-
106
-
107
-
108
-
109
-
110
-
111
-
112
-
113
-
114
-
115
-
116
-
117
-
118
-
119
-
120
 |
 |

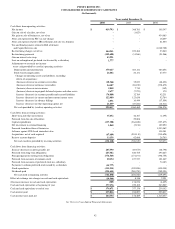
42
PITNEY BOWES INC.
CONSOLIDATED STATEMENTS OF CASH FLOWS
(In thousands)
Years ended December 31,
2008 2007 2006
Cash flows from operating activities:
Net income $ 419,793 $ 366,781 $ 105,347
Gain on sale of a facility, net of tax - (1,623) -
Net gain on sale of businesses, net of tax - - 434,085
Non-cash expense from FSC tax law change - - 16,209
Non-cash expense related to IRS settlement and sale of a business - - 61,000
Tax and bond payments related to IRS settlement
and Capital Services sale - - (1,040,700)
Restructuring charges, net of tax 144,211 223,486 23,040
Restructuring payments (102,680) (31,568) (51,566)
Gain on interest rate swap 43,991 - -
Loss on redemption of preferred stock issued by a subsidiary 1,777 - -
Adjustments to reconcile net income
to net cash provided by (used in) operating activities:
Depreciation and amortization 379,117 383,141 363,258
Stock-based compensation 26,402 24,131 27,375
Changes in operating assets and liabilities, excluding
effects of acquisitions:
(Increase) decrease in accounts receivables (20,366) 35,853 (46,623)
(Increase) decrease in finance receivables 24,387 (86,238) (236,872)
(Increase) decrease in inventories 2,018 7,710 (142)
(Increase) decrease in prepaid, deferred expense and other assets 2,677 (7,793) 170
Increase (decrease) in accounts payable and accrued liabilities (76,880) 32,789 42,231
Increase (decrease) in current and non-current income taxes 122,480 123,636 52,784
Increase (decrease) in advance billings 2,051 10,444 (17,559)
Increase (decrease) in other operating capital, net 21,459 (20,284) (18,611)
Net cash provided by (used in) operating activities 990,437 1,060,465 (286,574)
Cash flows from investing activities:
Short-term and other investments 35,652 42,367 (1,295)
Proceeds from the sale of facilities - 29,608 -
Capital expenditures (237,308) (264,656) (327,877)
Net investment in external financing 1,868 (2,214) 109,050
Proceeds from divestiture of businesses - - 1,003,062
Advance against COLI cash surrender value - - 138,381
Acquisitions, net of cash acquired (67,689) (594,110) (230,628)
Reserve account deposits 33,359 62,666 28,780
Net cash (used in) provided by investing activities (234,118) (726,339) 719,473
Cash flows from financing activities:
Increase (decrease) in notes payable, net 205,590 (89,673) (26,790)
Proceeds from long-term obligations 245,582 640,765 493,285
Principal payments on long-term obligations (576,565) (174,191) (396,755)
Proceeds from issuance of common stock 20,154 107,517 101,449
Proceeds from issuance of preferred stock in a subsidiary - - 74,165
Payments to redeem preferred stock issued by a subsidiary (11,777) - -
Stock repurchases (333,231) (399,996) (400,000)
Dividends paid (291,611) (288,790) (285,051)
Net cash used in financing activities (741,858) (204,368) (439,697)
Effect of exchange rate changes on cash and cash equivalents (14,966) 8,316 2,391
(Decrease) increase in cash and cash equivalents (505) 138,074 (4,407)
Cash and cash equivalents at beginning of year 377,176 239,102 243,509
Cash and cash equivalents at end of year $ 376,671 $ 377,176 $ 239,102
Cash interest paid $ 235,816 $ 236,697 $ 225,837
Cash income taxes paid, net $ 164,354 $ 178,469 $ 1,315,437
See Notes to Consolidated Financial Statements