Pitney Bowes 2008 Annual Report Download - page 16
Download and view the complete annual report
Please find page 16 of the 2008 Pitney Bowes annual report below. You can navigate through the pages in the report by either clicking on the pages listed below, or by using the keyword search tool below to find specific information within the annual report.-
 1
1 -
2
-
3
-
4
-
5
-
 6
6 -
 7
7 -
 8
8 -
 9
9 -
 10
10 -
 11
11 -
 12
12 -
 13
13 -
 14
14 -
 15
15 -
 16
16 -
 17
17 -
 18
18 -
 19
19 -
 20
20 -
 21
21 -
 22
22 -
 23
23 -
 24
24 -
 25
25 -
 26
26 -
27
-
28
-
29
-
30
-
31
-
32
-
33
-
34
-
35
-
36
-
37
-
38
-
39
-
40
-
41
-
42
-
43
-
44
-
45
-
46
-
47
-
48
-
49
-
50
-
51
-
52
-
53
-
54
-
55
-
56
-
57
-
58
-
59
-
60
-
61
-
62
-
63
-
64
-
65
-
66
-
67
-
68
-
69
-
70
-
71
-
72
-
73
-
74
-
75
-
76
-
77
-
78
-
79
-
80
-
81
-
82
-
83
-
84
-
85
-
86
-
87
-
88
-
89
-
90
-
91
-
92
-
93
-
94
-
95
-
96
-
97
-
98
-
99
-
100
-
101
-
102
-
103
-
104
-
105
-
106
-
107
-
108
-
109
-
110
-
111
-
112
-
113
-
114
-
115
-
116
-
117
-
118
-
119
-
120
 |
 |

14
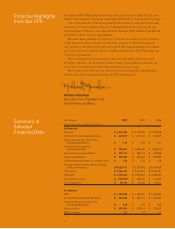
Summary of
Selected
Financial Data
increase in R&D expenditures to bring new solutions to market. In total, we
expect the program to generate more than $200 million in annualized savings.
Our commitment to delivering shareholder value is refl ected in the way
we used our cash to deliver returns to shareholders. During the year we
returned $625 million to our shareholders through $292 million in dividends
and $333 million in share repurchases.
We were also pleased to provide a 3 percent increase in our dividend,
to $0.36 per common share, for the fi rst quarter of 2009. Because of
our attractive dividend yield and increased adjusted earnings per share,
our total return to shareholders in 2008 outpaced the S&P 500 index by
7 percentage points.
With a lowered cost structure, enhanced operating effi ciency and
stronger liquidity, we are better positioned to successfully navigate an
uncertain environment today than we were one year ago.
We remain committed to disciplined action to maximize shareholder
return and deliver sustained value in 2009 and beyond.
Michael Monahan
Executive Vice President and
Chief Financial Offi cer
Financial Highlights
from Our CFO
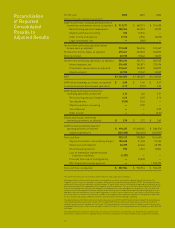
For the year 2008 2007 2006
(Dollars in thousands, except per share amounts)
As Reported
Revenue $ 6,262,305 $ 6,129,795 $ 5,730,018
Income from continuing operations $ 447,493 $ 361,247 $ 565,659
Diluted earnings per share from
continuing operations $ 2.13 $ 1.63 $ 2.51
Cash provided by (used in)
operating activities $ 990,437 $ 1,060,465 $ (286,574)
Depreciation and amortization $ 379,117 $ 383,141 $ 363,258
Capital expenditures $ 237,308 $ 264,656 $ 327,877
Cash dividends per share of common stock $ 1.40 $ 1.32 $ 1.28
Average common and potential common
shares outstanding 209,699,471 221,219,746 225,443,060
Total assets $ 8,736,431 $ 9,465,731 $ 8,527,331
Total debt $ 4,705,366 $ 4,755,842 $ 4,338,157
Stockholders’ equity $ (187,879) $ 660,169 $ 716,055
Total employees $ 35,140 $ 36,165 $ 34,454
As Adjusted
EBIT $ 1,136,085 $ 1,186,097 $ 1,160,063
Income from continuing operations $ 583,233
$ 601,114 $ 606,765
Diluted earnings per share from
continuing operations $ 2.78 $ 2.72 $ 2.69
Free cash fl ow $ 887,984 $ 923,914 $ 523,439
EBIT to interest 5.2 4.9 5.5