Pitney Bowes 2008 Annual Report Download - page 83
Download and view the complete annual report
Please find page 83 of the 2008 Pitney Bowes annual report below. You can navigate through the pages in the report by either clicking on the pages listed below, or by using the keyword search tool below to find specific information within the annual report.-
 1
1 -
2
-
3
-
4
-
5
-
6
-
7
-
8
-
9
-
10
-
11
-
12
-
13
-
14
-
15
-
16
-
17
-
18
-
19
-
20
-
21
-
22
-
23
-
24
-
25
-
26
-
27
-
28
-
29
-
30
-
31
-
32
-
33
-
34
-
35
-
36
-
37
-
38
-
39
-
40
-
41
-
42
-
43
-
44
-
45
-
46
-
47
-
48
-
49
-
50
-
51
-
52
-
53
-
54
-
55
-
56
-
57
-
58
-
59
-
60
-
61
-
62
-
63
-
64
-
65
-
66
-
67
-
68
-
69
-
70
-
71
-
72
-
 73
73 -
 74
74 -
 75
75 -
 76
76 -
 77
77 -
 78
78 -
 79
79 -
 80
80 -
 81
81 -
 82
82 -
 83
83 -
 84
84 -
 85
85 -
 86
86 -
 87
87 -
 88
88 -
 89
89 -
 90
90 -
 91
91 -
 92
92 -
 93
93 -
94
-
95
-
96
-
97
-
98
-
99
-
100
-
101
-
102
-
103
-
104
-
105
-
106
-
107
-
108
-
109
-
110
-
111
-
112
-
113
-
114
-
115
-
116
-
117
-
118
-
119
-
120
 |
 |

PITNEY BOWES INC.
NOTES TO CONSOLIDATED FINANCIAL STATEMENTS
(Tabular dollars in thousands, except per share data)
64
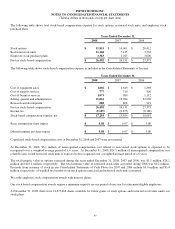
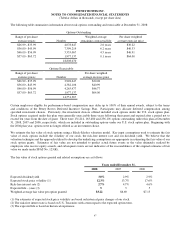
The following table summarizes the preferred, preference and common stock outstanding:
Common Stock
Preferred
Stock Preference
Stock Issued Treasury Outstanding
Balance, December 31, 2005 335 42,946 323,337,912 (96,630,706) 226,707,206
Repurchase of common stock (9,180,216)
Issuances of common stock 3,026,290
Conversions of common stock (200) (3,339) 60,042
Balance, December 31, 2006 135 39,607 323,337,912 (102,724,590) 220,613,322
Repurchase of common stock (9,075,104)
Issuances of common stock 2,934,801
Conversions of common stock - (2,538) 41,940
Balance, December 31, 2007 135 37,069 323,337,912 (108,822,953) 214,514,959
Repurchase of common stock (9,246,535)
Issuances of common stock 896,030
Conversions of common stock - (1,013) 16,739
Balance, December 31, 2008 135 36,056 323,337,912 (117,156,719) 206,181,193
Accumulated Other Comprehensive (Loss) Income
The components of accumulated other comprehensive (loss) income are as follow:
2008 2007 2006
Foreign currency translation adjustments (1) $ 35,800 $ 341,252 $ 176,524
Net unrealized loss on derivatives (18,952) (282) (3,083)
Net unrealized gain on investment securities 932 352 -
Amortization of pension and postretirement costs 36,261 22,172 -
Net unamortized loss on pension and postretirement plans (2) (650,382) (274,838) (305,185)
Accumulated other comprehensive (loss) income $ (596,341) $ 88,656 $ (131,744)
(1) Includes net deferred translation gains of $41.7 million and $47.6 million for the years ended December 31, 2008 and 2007,
respectively. These amounts are associated with inter-company loans denominated in a foreign currency that have been designated as
a hedge of net investment.
(2) Includes a charge of $297.2 million for the initial adoption of FAS 158 in 2006.
12. Stock Plans
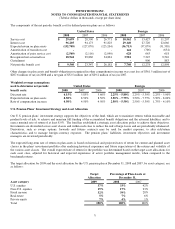
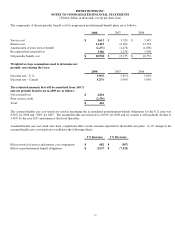
Effective January 1, 2006, we adopted the provisions of SFAS No. 123(R). SFAS No. 123(R) established accounting for stock-based
awards exchanged for employee services. Accordingly, stock-based compensation cost is measured at the grant date, based on the fair
value of the award, and is recognized as expense over the employee requisite service period.