Pitney Bowes 2008 Annual Report Download - page 105
Download and view the complete annual report
Please find page 105 of the 2008 Pitney Bowes annual report below. You can navigate through the pages in the report by either clicking on the pages listed below, or by using the keyword search tool below to find specific information within the annual report.-
 1
1 -
2
-
3
-
4
-
5
-
6
-
7
-
8
-
9
-
10
-
11
-
12
-
13
-
14
-
15
-
16
-
17
-
18
-
19
-
20
-
21
-
22
-
23
-
24
-
25
-
26
-
27
-
28
-
29
-
30
-
31
-
32
-
33
-
34
-
35
-
36
-
37
-
38
-
39
-
40
-
41
-
42
-
43
-
44
-
45
-
46
-
47
-
48
-
49
-
50
-
51
-
52
-
53
-
54
-
55
-
56
-
57
-
58
-
59
-
60
-
61
-
62
-
63
-
64
-
65
-
66
-
67
-
68
-
69
-
70
-
71
-
72
-
73
-
74
-
75
-
76
-
77
-
78
-
79
-
80
-
81
-
82
-
83
-
84
-
85
-
86
-
87
-
88
-
89
-
90
-
91
-
92
-
93
-
94
-
 95
95 -
 96
96 -
 97
97 -
 98
98 -
 99
99 -
 100
100 -
 101
101 -
 102
102 -
 103
103 -
 104
104 -
 105
105 -
 106
106 -
 107
107 -
 108
108 -
 109
109 -
 110
110 -
 111
111 -
 112
112 -
 113
113 -
 114
114 -
 115
115 -
116
-
117
-
118
-
119
-
120
 |
 |

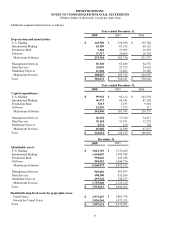
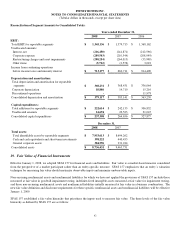
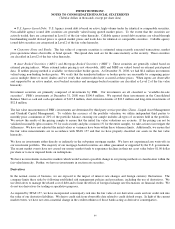
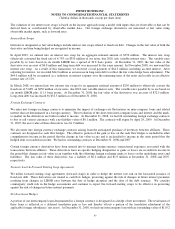
PITNEY BOWES INC.
NOTES TO CONSOLIDATED FINANCIAL STATEMENTS
(Tabular dollars in thousands, except per share data)
86
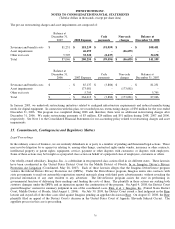
million designated as a net investment hedge. At December 31, 2007, we had two intercompany loans with an outstanding value of
$126.4 million associated with net investment hedges. Net deferred translation gains of $41.7 million and $37.4 million for 2008 and
2007, respectively, were included in accumulated other comprehensive (loss) income in stockholders’ (deficit) equity on the
Consolidated Balance Sheets.
The estimated fair value of our financial instruments follows:
December 31, 2008 December 31, 2007
Carrying
value (1)
Fair value
Carrying
value (1)
Fair value
Investment securities $ 251,298 $ 252,776 $ 200,006 $ 200,005
Loans receivable $ 528,800 $ 528,800 $ 554,370 $ 554,370
Long-term debt $ (3,990,134) $ (3,880,418) $ (3,848,359) $ (3,722,209)
Derivatives, net $ 874 $ 874 $ 7,623 $ 7,623
(1) Carrying value includes accrued interest and deferred fee income, where applicable.
The fair value of long-term debt is estimated based on quoted dealer prices for the same or similar issues. The carrying value for cash,
cash equivalents, accounts receivable, loans receivable, accounts payable and notes payable approximate fair value because of the
short maturity of these instruments.
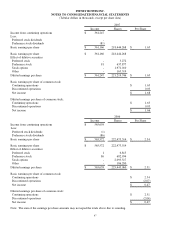
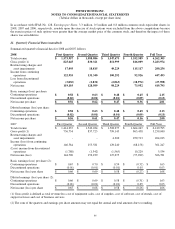
20. Earnings per Share
A reconciliation of the basic and diluted earnings per share computations for income from continuing operations for the years ended
December 31, 2008, 2007 and 2006 is as follows:
2008
Income Shares Per Share
Income from continuing operations $ 447,493
Less:
Preferred stock dividends -
Preference stock dividends (77)
Basic earnings per share $ 447,416 208,425,191 $ 2.15
Basic earnings per share $ 447,416 208,425,191
Effect of dilutive securities:
Preferred stock - 3,272
Preference stock 77 600,733
Stock options - 567,305
Other - 102,970
Diluted earnings per share $ 447,493 209,699,471 $ 2.13
Basic earnings per share of common stock:
Continuing operations $ 2.15
Discontinued operations (0.13)
Net income $ 2.01
Diluted earnings per share of common stock:
Continuing operations $ 2.13
Discontinued operations (0.13)
Net income $ 2.00