Pitney Bowes 2008 Annual Report Download - page 29
Download and view the complete annual report
Please find page 29 of the 2008 Pitney Bowes annual report below. You can navigate through the pages in the report by either clicking on the pages listed below, or by using the keyword search tool below to find specific information within the annual report.-
 1
1 -
2
-
3
-
4
-
5
-
6
-
7
-
8
-
9
-
10
-
11
-
12
-
13
-
14
-
15
-
16
-
17
-
18
-
 19
19 -
 20
20 -
 21
21 -
 22
22 -
 23
23 -
 24
24 -
 25
25 -
 26
26 -
 27
27 -
 28
28 -
 29
29 -
 30
30 -
 31
31 -
 32
32 -
 33
33 -
 34
34 -
 35
35 -
 36
36 -
 37
37 -
 38
38 -
 39
39 -
40
-
41
-
42
-
43
-
44
-
45
-
46
-
47
-
48
-
49
-
50
-
51
-
52
-
53
-
54
-
55
-
56
-
57
-
58
-
59
-
60
-
61
-
62
-
63
-
64
-
65
-
66
-
67
-
68
-
69
-
70
-
71
-
72
-
73
-
74
-
75
-
76
-
77
-
78
-
79
-
80
-
81
-
82
-
83
-
84
-
85
-
86
-
87
-
88
-
89
-
90
-
91
-
92
-
93
-
94
-
95
-
96
-
97
-
98
-
99
-
100
-
101
-
102
-
103
-
104
-
105
-
106
-
107
-
108
-
109
-
110
-
111
-
112
-
113
-
114
-
115
-
116
-
117
-
118
-
119
-
120
 |
 |

10
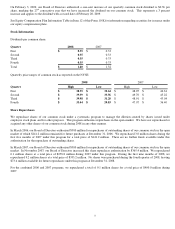
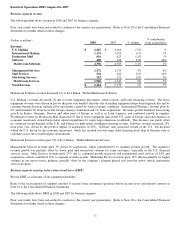
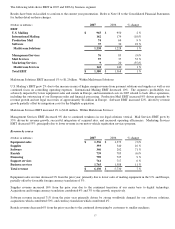
ITEM 6. – SELECTED FINANCIAL DATA
The following tables summarize selected financial data for the Company, and should be read in conjunction with the more detailed
consolidated financial statements and related notes thereto included under Item 8 of this Form 10-K.
Summary of Selected Financial Data
(Dollars in thousands, except per share amounts)
Years ended December 31,
2008 2007 2006 2005 2004
Total revenue $ 6,262,305 $ 6,129,795 $ 5,730,018 $ 5,366,936 $ 4,832,304
Total costs and expenses 5,549,128 5,469,084 4,815,528 4,555,268 4,223,914
Income from continuing operations
before income taxes and minority interest 713,177 660,711 914,490 811,668 608,390
Provision for income taxes 244,929 280,222 335,004 328,597 197,317
Minority interest (preferred stock dividends
of subsidiaries) 20,755 19,242 13,827 9,828 5,634
Income from continuing operations 447,493 361,247 565,659 473,243 405,439
(Loss) income from discontinued operations,
net income tax (27,700) 5,534 (460,312) 35,368 56,557
Net income $ 419,793 $ 366,781 $ 105,347 $ 508,611 $ 461,996
Basic earnings per share of common stock: (1)
Continuing operations $ 2.15 $ 1.65 $ 2.54 $ 2.07 $ 1.76
Discontinued operations (0.13) 0.03 (2.07) 0.15 0.24
Net income $ 2.01 $ 1.68 $ 0.47 $ 2.22 $ 2.00
Diluted earnings per share of common stock:
Continuing operations $ 2.13 $ 1.63 $ 2.51 $ 2.04 $ 1.73
Discontinued operations (0.13) 0.03 (2.04) 0.15 0.24
Net income $ 2.00 $ 1.66 $ 0.47 $ 2.19 $ 1.97
Total cash dividends on common,
preference and preferred stock $ 291,611 $ 288,790 $ 285,051 $ 284,348 $ 282,265
Cash dividends per share of common stock $ 1.40 $ 1.32 $ 1.28 $ 1.24 $ 1.22
Average common and potential
common shares outstanding 209,699,471 221,219,746 225,443,060 232,089,178 234,229,987
Depreciation and amortization $ 379,117 $ 383,141 $ 363,258 $ 331,963 $ 306,750
Capital expenditures $ 237,308 $ 264,656 $ 327,877 $ 291,550 $ 316,982
Balance sheet
Total assets $ 8,736,431 $ 9,465,731 $ 8,527,331 $ 10,553,957 $ 10,161,682
Long-term debt $ 3,934,865 $ 3,802,075 $ 3,847,617 $ 3,849,623 $ 3,164,688
Total debt $ 4,705,366 $ 4,755,842 $ 4,338,157 $ 4,707,365 $ 4,375,163
Preferred stockholders’ equity in
subsidiary companies $ 374,165 $ 384,165 $ 384,165 $ 310,000 $ 310,000
Stockholders’ (deficit) equity (see Note 9) $ (187,879) $ 660,169 $ 716,055 $ 1,381,115 $ 1,366,018
Other
Common stockholders of record 21,914 21,574 22,923 23,639 26,129
Total employees 35,140 36,165 34,454 34,165 35,183
(1) The sum of the earnings per share amounts may not equal the totals above due to rounding.