Pitney Bowes 2008 Annual Report Download - page 73
Download and view the complete annual report
Please find page 73 of the 2008 Pitney Bowes annual report below. You can navigate through the pages in the report by either clicking on the pages listed below, or by using the keyword search tool below to find specific information within the annual report.-
 1
1 -
2
-
3
-
4
-
5
-
6
-
7
-
8
-
9
-
10
-
11
-
12
-
13
-
14
-
15
-
16
-
17
-
18
-
19
-
20
-
21
-
22
-
23
-
24
-
25
-
26
-
27
-
28
-
29
-
30
-
31
-
32
-
33
-
34
-
35
-
36
-
37
-
38
-
39
-
40
-
41
-
42
-
43
-
44
-
45
-
46
-
47
-
48
-
49
-
50
-
51
-
52
-
53
-
54
-
55
-
56
-
57
-
58
-
59
-
60
-
61
-
62
-
 63
63 -
 64
64 -
 65
65 -
 66
66 -
 67
67 -
 68
68 -
 69
69 -
 70
70 -
 71
71 -
 72
72 -
 73
73 -
 74
74 -
 75
75 -
 76
76 -
 77
77 -
 78
78 -
 79
79 -
 80
80 -
 81
81 -
 82
82 -
 83
83 -
84
-
85
-
86
-
87
-
88
-
89
-
90
-
91
-
92
-
93
-
94
-
95
-
96
-
97
-
98
-
99
-
100
-
101
-
102
-
103
-
104
-
105
-
106
-
107
-
108
-
109
-
110
-
111
-
112
-
113
-
114
-
115
-
116
-
117
-
118
-
119
-
120
 |
 |

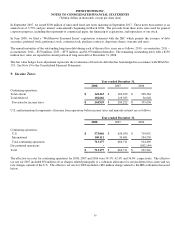
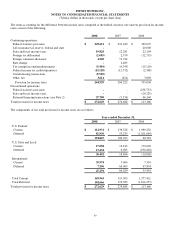
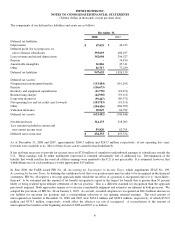
PITNEY BOWES INC.
NOTES TO CONSOLIDATED FINANCIAL STATEMENTS
(Tabular dollars in thousands, except per share data)
54
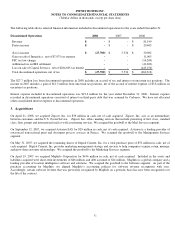
The pro forma earnings of these acquisitions for 2008 did not have a material impact on our financial results. The pro forma earnings
for acquisitions in 2007 reduced our diluted earnings per share by approximately 6 cents, primarily due to the purchase accounting
alignment for MapInfo. The pro forma consolidated results do not purport to be indicative of the actual results if the acquisitions had
occurred on the dates indicated or that may result in the future.
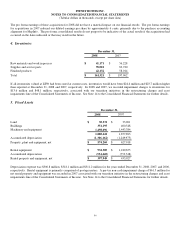
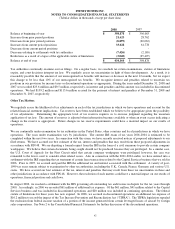
4. Inventories
December 31,
2008 2007
Raw materials and work in process $ 41,171 $ 56,228
Supplies and service parts 78,018 83,720
Finished products 42,132 58,014
Total $ 161,321 $ 197,962
If all inventories valued at LIFO had been stated at current costs, inventories would have been $24.4 million and $23.7 million higher
than reported at December 31, 2008 and 2007, respectively. In 2008 and 2007, we recorded impairment charges to inventories for
$13.6 million and $48.1 million, respectively, associated with our transition initiatives in the restructuring charges and asset
impairments line of the Consolidated Statements of Income. See Note 14 to the Consolidated Financial Statements for further details.
5. Fixed Assets
December 31,
2008 2007
Land $ 30,531 $ 33,961
Buildings 351,195 400,548
Machinery and equipment 1,498,696 1,443,384
1,880,422 1,877,893
Accumulated depreciation (1,306,162) (1,249,975)
Property, plant and equipment, net $ 574,260 $ 627,918
Rental equipment $ 932,389 $ 1,189,675
Accumulated depreciation (534,440) (753,748)
Rental property and equipment, net $ 397,949 $ 435,927
Depreciation expense was $306.8 million, $318.1 million and $311.2 million for the years ended December 31, 2008, 2007, and 2006,
respectively. Rental equipment is primarily comprised of postage meters. A pre-tax non-cash impairment charge of $61.5 million for
net rental property and equipment was recorded in 2007 associated with our transition initiative in the restructuring charges and asset
impairments line of the Consolidated Statements of Income. See Note 14 to the Consolidated Financial Statements for further details.