Pitney Bowes 2008 Annual Report Download - page 34
Download and view the complete annual report
Please find page 34 of the 2008 Pitney Bowes annual report below. You can navigate through the pages in the report by either clicking on the pages listed below, or by using the keyword search tool below to find specific information within the annual report.-
 1
1 -
2
-
3
-
4
-
5
-
6
-
7
-
8
-
9
-
10
-
11
-
12
-
13
-
14
-
15
-
16
-
17
-
18
-
19
-
20
-
21
-
22
-
23
-
 24
24 -
 25
25 -
 26
26 -
 27
27 -
 28
28 -
 29
29 -
 30
30 -
 31
31 -
 32
32 -
 33
33 -
 34
34 -
 35
35 -
 36
36 -
 37
37 -
 38
38 -
 39
39 -
 40
40 -
 41
41 -
 42
42 -
 43
43 -
 44
44 -
45
-
46
-
47
-
48
-
49
-
50
-
51
-
52
-
53
-
54
-
55
-
56
-
57
-
58
-
59
-
60
-
61
-
62
-
63
-
64
-
65
-
66
-
67
-
68
-
69
-
70
-
71
-
72
-
73
-
74
-
75
-
76
-
77
-
78
-
79
-
80
-
81
-
82
-
83
-
84
-
85
-
86
-
87
-
88
-
89
-
90
-
91
-
92
-
93
-
94
-
95
-
96
-
97
-
98
-
99
-
100
-
101
-
102
-
103
-
104
-
105
-
106
-
107
-
108
-
109
-
110
-
111
-
112
-
113
-
114
-
115
-
116
-
117
-
118
-
119
-
120
 |
 |

15
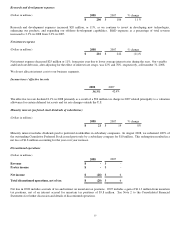
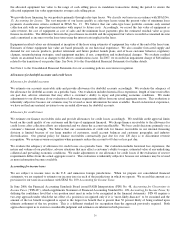
Research and development expenses
(Dollars in millions) 2008 2007 % change
$ 206 $ 186 11 %
Research and development expenses increased $20 million, or 11%, as we continue to invest in developing new technologies,
enhancing our products, and expanding our offshore development capabilities. R&D expenses as a percentage of total revenue
increased to 3.3% in 2008 from 3.0% in 2007.
Net interest expense
(Dollars in millions) 2008 2007 % change
$ 216 $ 242 (11)%
Net interest expense decreased $25 million or 11%, from prior year due to lower average interest rates during the year. Our variable
and fixed rate debt mix, after adjusting for the effect of interest rate swaps, was 22% and 78%, respectively, at December 31, 2008.
We do not allocate interest costs to our business segments.
Income taxes / effective tax rate
2008 2007
34.3% 42.4%
The effective tax rate declined 8.1% in 2008 primarily as a result of a $54 million tax charge in 2007 related principally to a valuation
allowance for certain deferred tax assets and tax rate changes outside the U.S.
Minority interest (preferred stock dividends of subsidiaries)
(Dollars in millions)
2008 2007 % change
$ 21 $ 19 8%
Minority interest includes dividends paid to preferred stockholders in subsidiary companies. In August 2008, we redeemed 100% of
the outstanding Cumulative Preferred Stock issued previously by a subsidiary company for $10 million. This redemption resulted in a
net loss of $1.8 million accounting for the year over year increase.
Discontinued operations
(Dollars in millions)
2008 2007
Revenue $ - $ -
Pretax income $ - $ -
Net income $(28) $6
Total discontinued operations, net of tax $(28) $6
Net loss in 2008 includes accruals of tax and interest on uncertain tax positions. 2007 includes a gain of $11.3 million from uncertain
tax positions, net of an interest accrual for uncertain tax positions of $5.8 million. See Note 2 to the Consolidated Financial
Statements for further discussion and details of discontinued operations.