Pitney Bowes 2008 Annual Report Download - page 33
Download and view the complete annual report
Please find page 33 of the 2008 Pitney Bowes annual report below. You can navigate through the pages in the report by either clicking on the pages listed below, or by using the keyword search tool below to find specific information within the annual report.-
 1
1 -
2
-
3
-
4
-
5
-
6
-
7
-
8
-
9
-
10
-
11
-
12
-
13
-
14
-
15
-
16
-
17
-
18
-
19
-
20
-
21
-
22
-
 23
23 -
 24
24 -
 25
25 -
 26
26 -
 27
27 -
 28
28 -
 29
29 -
 30
30 -
 31
31 -
 32
32 -
 33
33 -
 34
34 -
 35
35 -
 36
36 -
 37
37 -
 38
38 -
 39
39 -
 40
40 -
 41
41 -
 42
42 -
 43
43 -
44
-
45
-
46
-
47
-
48
-
49
-
50
-
51
-
52
-
53
-
54
-
55
-
56
-
57
-
58
-
59
-
60
-
61
-
62
-
63
-
64
-
65
-
66
-
67
-
68
-
69
-
70
-
71
-
72
-
73
-
74
-
75
-
76
-
77
-
78
-
79
-
80
-
81
-
82
-
83
-
84
-
85
-
86
-
87
-
88
-
89
-
90
-
91
-
92
-
93
-
94
-
95
-
96
-
97
-
98
-
99
-
100
-
101
-
102
-
103
-
104
-
105
-
106
-
107
-
108
-
109
-
110
-
111
-
112
-
113
-
114
-
115
-
116
-
117
-
118
-
119
-
120
 |
 |

14
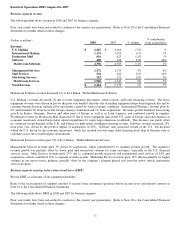
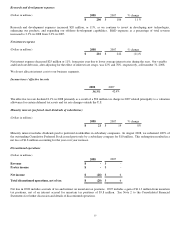
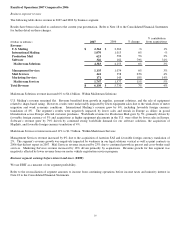
Software revenue increased by 23% from the prior year primarily driven by acquisitions which contributed 19% to revenue growth
and strong international demand for our location intelligence and customer communication software solutions. Foreign currency
translation had a negative impact of 2%.
Rentals revenue decreased 1% compared to the prior year. Favorable foreign currency translation of 1% and higher demand in France
were offset by lower revenue in the U.S., as our customers continue to downsize to smaller, fully featured machines.
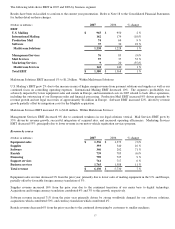
Financing revenue decreased 2% compared to the prior year. Lower equipment sales have resulted in a corresponding decline in the
U.S. lease portfolio.
Support services revenue increased 1% from the prior year primarily due to the favorable impact of foreign currency translation of
1%. Renewals and pricing increases offset the impact of customers down-sizing their equipment.
Business services revenue increased 9% from the prior year, of which acquisitions contributed 7%. The additional growth was driven
by higher revenues in Mail Services and Marketing Services, partly offset by lower transaction volumes in Management Services.
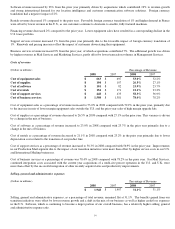
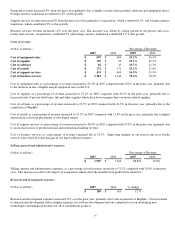
Costs of revenue
(Dollars in millions) Percentage of Revenue
2008 2007 2008 2007
Cost of equipment sales $663 $697 53.0% 52.2%
Cost of supplies $104 $107 26.5% 27.1%
Cost of software $101 $82 23.9% 23.7%
Cost of rentals $154 $171 21.1% 23.2%
Cost of support services $448 $433 58.3% 56.9%
Cost of business services $1,508 $1,381 78.4% 78.2%
Cost of equipment sales as a percentage of revenue increased to 53.0% in 2008 compared with 52.2% in the prior year, primarily due
to the increase in mix of lower margin equipment sales outside the U.S. and the prior year sales of high margin upgrade kits.
Cost of supplies as a percentage of revenue decreased to 26.5% in 2008 compared with 27.1% in the prior year. This variance is driven
by a change in the mix of business.
Cost of software as a percentage of revenue increased to 23.9% in 2008 compared with 23.7% in the prior year primarily due to a
change in the mix of business.
Cost of rentals as a percentage of revenue decreased to 21.1% in 2008 compared with 23.2% in the prior year primarily due to lower
depreciation costs related to the transition of our product line.
Cost of support services as a percentage of revenue increased to 58.3% in 2008 compared with 56.9% in the prior year. Improvements
in our Production Mail segment due to the impact of our transition initiatives were more than offset by higher service costs in our U.S.
and International Mailing businesses.
Cost of business services as a percentage of revenue was 78.4% in 2008 compared with 78.2% in the prior year. For Mail Services,
continued integration costs associated with the current year acquisitions of a multi-site presort operation in the U.S. and U.K. were
more than offset by the successful integration of other recently acquired sites and productivity improvements.
Selling, general and administrative expenses
(Dollars in millions) Percentage of Revenue
2008 2007 2008 2007
$ 1,948 $ 1,907 31.1% 31.1%
Selling, general and administrative expenses, as a percentage of total revenue, remained flat at 31.1%. The benefits gained from our
transition initiatives were offset by lower revenue growth and a shift in the mix of our business as well as higher credit loss expenses
in the U.S. Software, which is continuing to become a larger portion of our overall business, has a relatively higher selling, general
and administrative expense ratio.