Pitney Bowes 2008 Annual Report Download - page 17
Download and view the complete annual report
Please find page 17 of the 2008 Pitney Bowes annual report below. You can navigate through the pages in the report by either clicking on the pages listed below, or by using the keyword search tool below to find specific information within the annual report.-
 1
1 -
2
-
3
-
4
-
5
-
6
-
 7
7 -
 8
8 -
 9
9 -
 10
10 -
 11
11 -
 12
12 -
 13
13 -
 14
14 -
 15
15 -
 16
16 -
 17
17 -
 18
18 -
 19
19 -
 20
20 -
 21
21 -
 22
22 -
 23
23 -
 24
24 -
 25
25 -
 26
26 -
 27
27 -
28
-
29
-
30
-
31
-
32
-
33
-
34
-
35
-
36
-
37
-
38
-
39
-
40
-
41
-
42
-
43
-
44
-
45
-
46
-
47
-
48
-
49
-
50
-
51
-
52
-
53
-
54
-
55
-
56
-
57
-
58
-
59
-
60
-
61
-
62
-
63
-
64
-
65
-
66
-
67
-
68
-
69
-
70
-
71
-
72
-
73
-
74
-
75
-
76
-
77
-
78
-
79
-
80
-
81
-
82
-
83
-
84
-
85
-
86
-
87
-
88
-
89
-
90
-
91
-
92
-
93
-
94
-
95
-
96
-
97
-
98
-
99
-
100
-
101
-
102
-
103
-
104
-
105
-
106
-
107
-
108
-
109
-
110
-
111
-
112
-
113
-
114
-
115
-
116
-
117
-
118
-
119
-
120
 |
 |

15
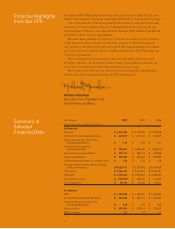
The sum of the earnings per share amounts may not equal the totals above due to rounding.
Management believes this presentation provides a reasonable basis on which to present the adjusted fi nancial information. The
Company’s fi nancial results are reported in accordance with generally accepted accounting principles (GAAP). The earnings per share
and free cash fl ow results are adjusted to exclude the impact of special items such as restructuring charges and write-downs of assets,
which materially impact the comparability of the Company’s results of operations. The use of free cash fl ow has limitations. GAAP cash
fl ow has the advantage of including all cash available to the Company after actual expenditures for all purposes. Free cash fl ow is the
amount of cash that management could have available for discretionary uses if it made different decisions about employing its cash. It
adds back long-term commitments such as capital expenditures, as well as special items such as cash used for restructuring charges.
All of these items use cash that is not otherwise available to the Company and are important expenditures. Management compensates
for these limitations by using a combination of GAAP cash fl ow and free cash fl ow in doing its planning.
The adjusted fi nancial information and certain fi nancial measures such as EBIT and EBIT to interest are intended to be more indicative
of the ongoing operations and economic results of the Company. EBIT excludes interest and taxes, and as a result has the effect of
showing a greater amount of earnings than net income. The Company believes that interest and taxes, though important, do not refl ect
management effectiveness as these items are largely outside of its control. In assessing performance, the Company uses both EBIT and
net income.
This adjusted fi nancial information should not be construed as an alternative to our reported results determined in accordance with
GAAP. Further, our defi nition of this adjusted fi nancial information may differ from similarly titled measures used by other companies.
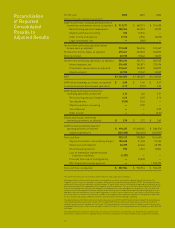
Reconciliation
of Reported
Consolidated
Results to
Adjusted Results
For the year 2008 2007 2006
(Dollars in thousands, except per share amounts)
GAAP income from continuing operations before
income taxes and minority interest, as reported $ 713,177 $ 660,711 $ 914,490
Restructuring and asset impairments 200,254 264,013 35,999
MapInfo purchase accounting 492 16,926 —
Other income and expense 5,712 2,956 (3,022)
Legal settlements, net — (380) —
Income from continuing operations before
income taxes, as adjusted 919,635 944,226 947,467
Provision for income taxes, as adjusted 315,647 323,870 326,875
Minority interest 20,755 19,242 13,827
Income from continuing operations, as adjusted 583,233 601,114 606,765
Interest expense, net 216,450 241,871 212,596
Provision for income taxes, as adjusted 315,647 323,870 326,875
Minority interest 20,755 19,242 13,827
EBIT $ 1,136,085 $ 1,186,097 $ 1,160,063
GAAP diluted earnings per share, as reported $ 2.00 $ 1.66 $ 0.47
Loss (income) from discontinued operations 0.13 (0.03) 2.04
GAAP diluted earnings per share from
continuing operations, as reported 2.13 1.63 2.51
Restructuring and asset impairments 0.69 0.87 0.10
Tax adjustments (0.04) 0.16 —
MapInfo purchase accounting — 0.05 —
Tax settlement — — 0.09
Other income — — (0.01)
Diluted earnings per share from
continuing operations, as adjusted $ 2.78 $ 2.72 $ 2.69
GAAP net cash provided by (used in)
operating activities, as reported $ 990,437 $ 1,060,465 $ (286,574)
Capital expenditures (237,308) (264,656) (327,877)
Free cash fl ow 753,129 795,809 (614,451)
Payments related to restructuring charges 102,680 31,568 51,566
Reserve account deposits 33,359 62,666 28,780
Discontinued operations 593 4,263 16,844
Loss on redemption of preferred stock
issued by a subsidiary (1,777) — —
Proceeds from sale of training facility — 29,608 —
IRS / Capital Services tax payment — — 1,040,700
Free cash fl ow, as adjusted $ 887,984 $ 923,914 $ 523,439