Pitney Bowes 2008 Annual Report Download - page 28
Download and view the complete annual report
Please find page 28 of the 2008 Pitney Bowes annual report below. You can navigate through the pages in the report by either clicking on the pages listed below, or by using the keyword search tool below to find specific information within the annual report.-
 1
1 -
2
-
3
-
4
-
5
-
6
-
7
-
8
-
9
-
10
-
11
-
12
-
13
-
14
-
15
-
16
-
17
-
 18
18 -
 19
19 -
 20
20 -
 21
21 -
 22
22 -
 23
23 -
 24
24 -
 25
25 -
 26
26 -
 27
27 -
 28
28 -
 29
29 -
 30
30 -
 31
31 -
 32
32 -
 33
33 -
 34
34 -
 35
35 -
 36
36 -
 37
37 -
 38
38 -
39
-
40
-
41
-
42
-
43
-
44
-
45
-
46
-
47
-
48
-
49
-
50
-
51
-
52
-
53
-
54
-
55
-
56
-
57
-
58
-
59
-
60
-
61
-
62
-
63
-
64
-
65
-
66
-
67
-
68
-
69
-
70
-
71
-
72
-
73
-
74
-
75
-
76
-
77
-
78
-
79
-
80
-
81
-
82
-
83
-
84
-
85
-
86
-
87
-
88
-
89
-
90
-
91
-
92
-
93
-
94
-
95
-
96
-
97
-
98
-
99
-
100
-
101
-
102
-
103
-
104
-
105
-
106
-
107
-
108
-
109
-
110
-
111
-
112
-
113
-
114
-
115
-
116
-
117
-
118
-
119
-
120
 |
 |

9
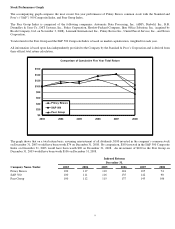
Stock Performance Graph
The accompanying graph compares the most recent five-year performance of Pitney Bowes common stock with the Standard and
Poor’s (“S&P”) 500 Composite Index, and Peer Group Index.
The Peer Group Index is comprised of the following companies: Automatic Data Processing, Inc. (ADP), Diebold, Inc., R.R.
Donnelley & Sons Co., DST Systems, Inc., Fedex Corporation, Hewlett-Packard Company, Ikon Office Solutions, Inc. (acquired by
Ricoh Company, Ltd. on November 3, 2008), Lexmark International, Inc., Pitney Bowes Inc., United Parcel Service, Inc., and Xerox
Corporation.
Total return for the Peer Group and the S&P 500 Composite Index is based on market capitalization, weighted for each year.
All information is based upon data independently provided to the Company by the Standard & Poor’s Corporation and is derived from
their official total return calculation.
Comparison of Cumulative Five Year Total Return
$0
$20
$40
$60
$80
$100
$120
$140
$160
2003 2004 2005 2006 2007 2008
Pitney Bowes
S&P 500
Peer Group
The graph shows that on a total return basis, assuming reinvestment of all dividends, $100 invested in the company’s common stock
on December 31, 2003 would have been worth $74 on December 31, 2008. By comparison, $100 invested in the S&P 500 Composite
Index on December 31, 2003 would have been worth $90 on December 31, 2008. An investment of $100 in the Peer Group on
December 31, 2003 would have been worth $106 on December 31, 2008.
Indexed Returns
December 31,
Company Name / Index 2003 2004 2005 2006 2007 2008
Pitney Bowes 100 117 110 124 105 74
S&P 500 100 111 116 135 142 90
Peer Group 100 112 115 137 143 106