Pitney Bowes 2008 Annual Report Download - page 59
Download and view the complete annual report
Please find page 59 of the 2008 Pitney Bowes annual report below. You can navigate through the pages in the report by either clicking on the pages listed below, or by using the keyword search tool below to find specific information within the annual report.-
 1
1 -
2
-
3
-
4
-
5
-
6
-
7
-
8
-
9
-
10
-
11
-
12
-
13
-
14
-
15
-
16
-
17
-
18
-
19
-
20
-
21
-
22
-
23
-
24
-
25
-
26
-
27
-
28
-
29
-
30
-
31
-
32
-
33
-
34
-
35
-
36
-
37
-
38
-
39
-
40
-
41
-
42
-
43
-
44
-
45
-
46
-
47
-
48
-
 49
49 -
 50
50 -
 51
51 -
 52
52 -
 53
53 -
 54
54 -
 55
55 -
 56
56 -
 57
57 -
 58
58 -
 59
59 -
 60
60 -
 61
61 -
 62
62 -
 63
63 -
 64
64 -
 65
65 -
 66
66 -
 67
67 -
 68
68 -
 69
69 -
70
-
71
-
72
-
73
-
74
-
75
-
76
-
77
-
78
-
79
-
80
-
81
-
82
-
83
-
84
-
85
-
86
-
87
-
88
-
89
-
90
-
91
-
92
-
93
-
94
-
95
-
96
-
97
-
98
-
99
-
100
-
101
-
102
-
103
-
104
-
105
-
106
-
107
-
108
-
109
-
110
-
111
-
112
-
113
-
114
-
115
-
116
-
117
-
118
-
119
-
120
 |
 |

40
PITNEY BOWES INC.
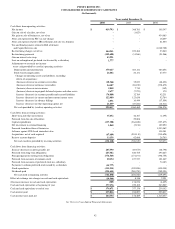
CONSOLIDATED STATEMENTS OF INCOME
(In thousands, except per share data)
Years ended December 31,
2008 2007 2006
Revenue:
Equipment sales $ 1,252,058 $ 1,335,538 $ 1,372,566
Supplies 392,414 393,478 339,594
Software 424,296 346,020 202,415
Rentals 728,160 739,130 785,068
Financing 772,711 790,121 725,131
Support services 768,424 760,915 716,556
Business services 1,924,242 1,764,593 1,588,688
Total revenue 6,262,305 6,129,795 5,730,018
Costs and expenses:
Cost of equipment sales 663,430 696,900 693,535
Cost of supplies 103,870 106,702 90,035
Cost of software 101,357 82,097 42,951
Cost of rentals 153,831 171,191 171,491
Cost of support services 447,745 433,324 400,089
Cost of business services 1,508,098 1,380,541 1,242,226
Selling, general and administrative 1,948,473 1,907,160 1,764,260
Research and development 205,620 185,665 165,368
Restructuring charges and asset impairments 200,254 264,013 35,999
Interest expense 229,343 250,540 228,418
Interest income (12,893) (8,669) (15,822)
Other income - (380) (3,022)
Total costs and expenses 5,549,128 5,469,084 4,815,528
Income from continuing operations before
income taxes and minority interest 713,177 660,711 914,490
Provision for income taxes 244,929 280,222 335,004
Minority interest (preferred stock dividends of subsidiaries) 20,755 19,242 13,827
Income from continuing operations 447,493 361,247 565,659
(Loss) income from discontinued operations,
net of income tax (27,700) 5,534 (460,312)
Net income $ 419,793 $ 366,781 $ 105,347
Basic earnings per share of common stock: (1)
Continuing operations $ 2.15 $ 1.65 $ 2.54
Discontinued operations (0.13) 0.03 (2.07)
Net income $ 2.01 $ 1.68 $ 0.47
Diluted earnings per share of common stock:
Continuing operations $ 2.13 $ 1.63 $ 2.51
Discontinued operations (0.13) 0.03 (2.04)
Net income $ 2.00 $ 1.66 $ 0.47
(1) The sum of earnings per share amounts may not equal the totals above due to rounding.
See Notes to Consolidated Financial Statements