Pitney Bowes 2008 Annual Report Download - page 107
Download and view the complete annual report
Please find page 107 of the 2008 Pitney Bowes annual report below. You can navigate through the pages in the report by either clicking on the pages listed below, or by using the keyword search tool below to find specific information within the annual report.-
 1
1 -
2
-
3
-
4
-
5
-
6
-
7
-
8
-
9
-
10
-
11
-
12
-
13
-
14
-
15
-
16
-
17
-
18
-
19
-
20
-
21
-
22
-
23
-
24
-
25
-
26
-
27
-
28
-
29
-
30
-
31
-
32
-
33
-
34
-
35
-
36
-
37
-
38
-
39
-
40
-
41
-
42
-
43
-
44
-
45
-
46
-
47
-
48
-
49
-
50
-
51
-
52
-
53
-
54
-
55
-
56
-
57
-
58
-
59
-
60
-
61
-
62
-
63
-
64
-
65
-
66
-
67
-
68
-
69
-
70
-
71
-
72
-
73
-
74
-
75
-
76
-
77
-
78
-
79
-
80
-
81
-
82
-
83
-
84
-
85
-
86
-
87
-
88
-
89
-
90
-
91
-
92
-
93
-
94
-
95
-
96
-
 97
97 -
 98
98 -
 99
99 -
 100
100 -
 101
101 -
 102
102 -
 103
103 -
 104
104 -
 105
105 -
 106
106 -
 107
107 -
 108
108 -
 109
109 -
 110
110 -
 111
111 -
 112
112 -
 113
113 -
 114
114 -
 115
115 -
 116
116 -
 117
117 -
118
-
119
-
120
 |
 |

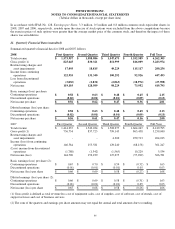
PITNEY BOWES INC.
NOTES TO CONSOLIDATED FINANCIAL STATEMENTS
(Tabular dollars in thousands, except per share data)
88
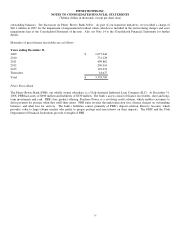
In accordance with SFAS No. 128, Earnings per Share, 3.3 million, 0.5 million and 0.8 million common stock equivalent shares in
2008, 2007 and 2006, respectively, issuable upon the exercise of stock options were excluded from the above computations because
the exercise prices of such options were greater than the average market price of the common stock, and therefore the impact of these
shares was anti-dilutive.
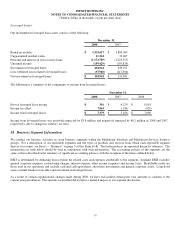
21. Quarterly Financial Data (unaudited)
Summarized quarterly financial data for 2008 and 2007 follows:
2008 First Quarter Second Quarter Third Quarter Fourth Quarter Full Year
Total revenue $ 1,573,957 $ 1,588,086 $ 1,547,673 $ 1,552,589 $ 6,262,305
Gross profit (1) 825,645 830,321 811,999 816,009 3,283,974
Restructuring charges and
asset impairments 17,093 18,815 49,229 115,117 200,254
Income from continuing
operations 122,935 131,340 100,292 92,926 447,493
Loss from discontinued
operations (3,832) (2,831) (2,063) (18,974) (27,700)
Net income 119,103 128,509 98,229 73,952 419,793
Basic earnings (loss) per share:
Continuing operations $ 0.58 $ 0.63 $ 0.48 $ 0.45 $ 2.15
Discontinued operations (0.02) (0.01) (0.01) (0.09) (0.13)
Net income per share $ 0.56 $ 0.62 $ 0.47 $ 0.36 $ 2.01
Diluted earnings (loss) per share:
Continuing operations $ 0.58 $ 0.63 $ 0.48 $ 0.45 $ 2.13
Discontinued operations (0.02) (0.01) (0.01) (0.09) (0.13)
Net income per share $ 0.56 $ 0.61 $ 0.47 $ 0.36 $ 2.00
2007 First Quarter Second Quarter Third Quarter Fourth Quarter Full Year
Total revenue $ 1,414,237 $ 1,543,034 $ 1,508,277 $ 1,664,247 $ 6,129,795
Gross profit (1) 756,734 837,725 799,143 865,438 3,259,040
Restructuring charges and
asset impairments - - 4,300 259,713 264,013
Income (loss) from continuing
operations 146,584 153,581 129,240 (68,158) 361,247
(Loss) income from discontinued
operations (1,788) (1,342) (1,565) 10,229 5,534
Net income (loss) 144,796 152,239 127,675 (57,929) 366,781
Basic earnings (loss) per share (2):
Continuing operations $ 0.67 $ 0.70 $ 0.59 $ (0.32) $ 1.65
Discontinued operations (0.01) (0.01) (0.01) 0.05 0.03
Net income (loss) per share $ 0.66 $ 0.69 $ 0.58 $ (0.27) $ 1.68
Diluted earnings (loss) per share (2):
Continuing operations $ 0.66 $ 0.69 $ 0.58 $ (0.31) $ 1.63
Discontinued operations (0.01) (0.01) (0.01) 0.05 0.03
Net income (loss) per share $ 0.65 $ 0.68 $ 0.58 $ (0.26) $ 1.66
(1) Gross profit is defined as total revenue less cost of equipment sales, cost of supplies, cost of software, cost of rentals, cost of
support services and cost of business services.
(2) The sum of the quarters and earnings per share amounts may not equal the annual and total amounts due to rounding.