Pitney Bowes 2008 Annual Report Download - page 84
Download and view the complete annual report
Please find page 84 of the 2008 Pitney Bowes annual report below. You can navigate through the pages in the report by either clicking on the pages listed below, or by using the keyword search tool below to find specific information within the annual report.-
 1
1 -
2
-
3
-
4
-
5
-
6
-
7
-
8
-
9
-
10
-
11
-
12
-
13
-
14
-
15
-
16
-
17
-
18
-
19
-
20
-
21
-
22
-
23
-
24
-
25
-
26
-
27
-
28
-
29
-
30
-
31
-
32
-
33
-
34
-
35
-
36
-
37
-
38
-
39
-
40
-
41
-
42
-
43
-
44
-
45
-
46
-
47
-
48
-
49
-
50
-
51
-
52
-
53
-
54
-
55
-
56
-
57
-
58
-
59
-
60
-
61
-
62
-
63
-
64
-
65
-
66
-
67
-
68
-
69
-
70
-
71
-
72
-
73
-
 74
74 -
 75
75 -
 76
76 -
 77
77 -
 78
78 -
 79
79 -
 80
80 -
 81
81 -
 82
82 -
 83
83 -
 84
84 -
 85
85 -
 86
86 -
 87
87 -
 88
88 -
 89
89 -
 90
90 -
 91
91 -
 92
92 -
 93
93 -
 94
94 -
95
-
96
-
97
-
98
-
99
-
100
-
101
-
102
-
103
-
104
-
105
-
106
-
107
-
108
-
109
-
110
-
111
-
112
-
113
-
114
-
115
-
116
-
117
-
118
-
119
-
120
 |
 |

PITNEY BOWES INC.
NOTES TO CONSOLIDATED FINANCIAL STATEMENTS
(Tabular dollars in thousands, except per share data)
65
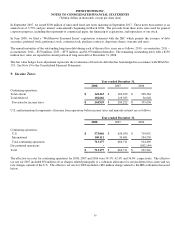
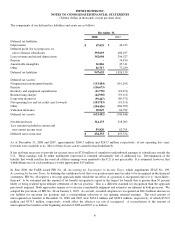
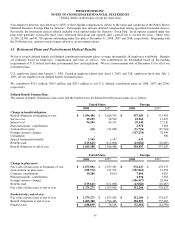
The following table shows total stock-
b
ased compensation expense for stock options, restricted stock units, and employee stoc
k
purchase plans.
Years Ended December 31,
2008 2007 2006
Stock options $ 11,851 $ 14,001 $ 20,412
Restricted stock units 11,168 7,115 3,363
Employee stock purchase plans 3,383 3,015 3,600
Pre-tax stock-based compensation $ 26,402 $ 24,131 $ 27,375
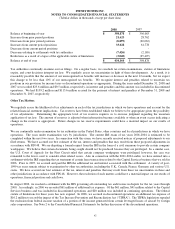
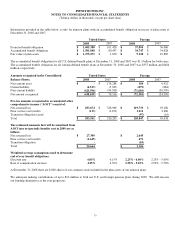
The following table shows stock-based compensation expense as included in the Consolidated Statements of Income:
Years Ended December 31,
2008 2007 2006
Cost of equipment sales $ 1,802 $ 1,649 $ 1,869
Cost of support services 777 710 806
Cost of business services 1,073 980 1,112
Selling, general and administrative 21,862 19,984 22,669
Research and development 888 808 919
Pre-tax stock-based compensation 26,402 24,131 27,375
Income tax (9,109) (8,277) (9,308)
Stock-based compensation expense, net $ 17,293 $ 15,854 $ 18,067
Basic earnings per share impact $ 0.08 $ 0.07 $ 0.08
Diluted earnings per share impact $ 0.08 $ 0.07 $ 0.08
Capitalized stock-based compensation costs at December 31, 2008 and 2007 were not material.
At December 31, 2008, $6.1 million of unrecognized compensation cost related to non-vested stock options is expected to be
recognized over a weighted average period of 1.6 years. At December 31, 2008, $24.5 million of unrecognized compensation cost
related to non-vested restricted stock units is expected to be recognized over a weighted average period of 1.8 years.
The total intrinsic value of options exercised during the years ended December 31, 2008, 2007 and 2006, was $1.1 million, $28.1
million and $23.2 million, respectively. The total intrinsic value of restricted stock units converted during 2008 was $4.2 million.
Proceeds from issuance of stock in our Consolidated Statements of Cash Flows for 2007 and 2006 include $5.0 million and $3.4
million, respectively, of windfall tax benefits from stock options exercised and restricted stock units converted.
We settle employee stock compensation awards with treasury shares.
Our stock-based compensation awards require a minimum requisite service period of one year for retirement eligible employees.
At December 31, 2008, there were 14,677,468 shares available for future grants of stock options and restricted stock units under our
stock plans.