Pitney Bowes 2008 Annual Report Download - page 101
Download and view the complete annual report
Please find page 101 of the 2008 Pitney Bowes annual report below. You can navigate through the pages in the report by either clicking on the pages listed below, or by using the keyword search tool below to find specific information within the annual report.-
 1
1 -
2
-
3
-
4
-
5
-
6
-
7
-
8
-
9
-
10
-
11
-
12
-
13
-
14
-
15
-
16
-
17
-
18
-
19
-
20
-
21
-
22
-
23
-
24
-
25
-
26
-
27
-
28
-
29
-
30
-
31
-
32
-
33
-
34
-
35
-
36
-
37
-
38
-
39
-
40
-
41
-
42
-
43
-
44
-
45
-
46
-
47
-
48
-
49
-
50
-
51
-
52
-
53
-
54
-
55
-
56
-
57
-
58
-
59
-
60
-
61
-
62
-
63
-
64
-
65
-
66
-
67
-
68
-
69
-
70
-
71
-
72
-
73
-
74
-
75
-
76
-
77
-
78
-
79
-
80
-
81
-
82
-
83
-
84
-
85
-
86
-
87
-
88
-
89
-
90
-
 91
91 -
 92
92 -
 93
93 -
 94
94 -
 95
95 -
 96
96 -
 97
97 -
 98
98 -
 99
99 -
 100
100 -
 101
101 -
 102
102 -
 103
103 -
 104
104 -
 105
105 -
 106
106 -
 107
107 -
 108
108 -
 109
109 -
 110
110 -
 111
111 -
112
-
113
-
114
-
115
-
116
-
117
-
118
-
119
-
120
 |
 |

PITNEY BOWES INC.
NOTES TO CONSOLIDATED FINANCIAL STATEMENTS
(Tabular dollars in thousands, except per share data)
82
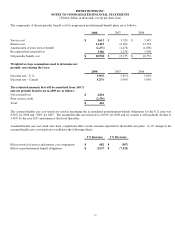
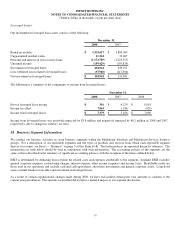
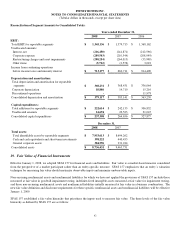
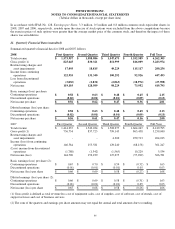
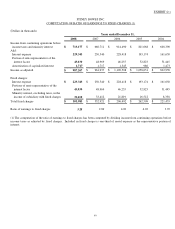
Reconciliation of Segment Amounts to Consolidated Totals:
Years ended December 31,
2008 2007 2006
EBIT:
Total EBIT for reportable segments $ 1,345,136 $ 1,379,715 $ 1,368,162
Unallocated amounts:
Interest, net (216,450) (241,871) (212,596)
Corporate expense (209,543) (210,544) (208,099)
Restructuring charges and asset impairments (200,254) (264,013) (35,999)
Other items (5,712) (2,576) 3,022
Income from continuing operations
before income taxes and minority interest $ 713,177 $ 660,711 $ 914,490
Depreciation and amortization:
Total depreciation and amortization for reportable
segments $ 360,231 $ 368,431 $ 336,064
Corporate depreciation 18,886 14,710 15,216
Discontinued operations - - 11,978
Consolidated depreciation and amortization $ 379,117 $ 383,141 $ 363,258
Capital expenditures:
Total additions for reportable segments $ 222,614 $ 242,133 $ 306,832
Unallocated amounts 14,694 22,523 21,045
Consolidated capital expenditures $ 237,308 $ 264,656 $ 327,877
December 31,
2008 2007
Total assets:
Total identifiable assets by reportable segments $ 7,953,613 $ 8,694,262
Cash and cash equivalents and short-term investments 398,222 440,455
General corporate assets 384,596 331,014
Consolidated assets $ 8,736,431 $ 9,465,731
19. Fair Value of Financial Instruments
Effective January 1, 2008, we adopted SFAS 157 for financial assets and liabilities. Fair value is a market-based measure considered
from the perspective of a market participant rather than an entity-specific measure. SFAS 157 emphasizes that an entity’s valuation
technique for measuring fair value should maximize observable inputs and minimize unobservable inputs.
Non-recurring nonfinancial assets and nonfinancial liabilities for which we have not applied the provisions of SFAS 157 include those
measured at fair value in goodwill impairment testing, indefinite-lived intangible assets measured at fair value for impairment testing,
and those non-recurring nonfinancial assets and nonfinancial liabilities initially measured at fair value in a business combination. The
new fair value definition and disclosure requirements for these specific nonfinancial assets and nonfinancial liabilities will be effective
January 1, 2009.
SFAS 157 established a fair value hierarchy that prioritizes the inputs used to measure fair value. The three levels of the fair value
hierarchy as defined by SFAS 157 are as follows: