Pep Boys 2007 Annual Report Download - page 84
Download and view the complete annual report
Please find page 84 of the 2007 Pep Boys annual report below. You can navigate through the pages in the report by either clicking on the pages listed below, or by using the keyword search tool below to find specific information within the annual report.-
 1
1 -
2
-
3
-
4
-
5
-
6
-
7
-
8
-
9
-
10
-
11
-
12
-
13
-
14
-
15
-
16
-
17
-
18
-
19
-
20
-
21
-
22
-
23
-
24
-
25
-
26
-
27
-
28
-
29
-
30
-
31
-
32
-
33
-
34
-
35
-
36
-
37
-
38
-
39
-
40
-
41
-
42
-
43
-
44
-
45
-
46
-
47
-
48
-
49
-
50
-
51
-
52
-
53
-
54
-
55
-
56
-
57
-
58
-
59
-
60
-
61
-
62
-
63
-
64
-
65
-
66
-
67
-
68
-
69
-
70
-
71
-
72
-
73
-
 74
74 -
 75
75 -
 76
76 -
 77
77 -
 78
78 -
 79
79 -
 80
80 -
 81
81 -
 82
82 -
 83
83 -
 84
84 -
 85
85 -
 86
86 -
 87
87 -
 88
88 -
 89
89 -
 90
90 -
 91
91 -
 92
92 -
 93
93 -
 94
94 -
95
-
96
-
97
-
98
-
99
-
100
-
101
-
102
-
103
-
104
-
105
-
106
-
107
-
108
-
109
-
110
-
111
-
112
-
113
-
114
-
115
-
116
-
117
-
118
-
119
-
120
-
121
-
122
-
123
-
124
-
125
-
126
-
127
-
128
-
129
-
130
-
131
-
132
-
133
-
134
-
135
-
136
-
137
-
138
-
139
-
140
-
141
-
142
-
143
-
144
-
145
-
146
-
147
-
148
 |
 |

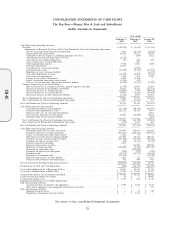
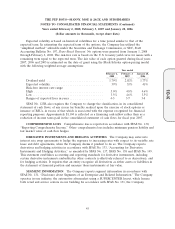
CONSOLIDATED STATEMENTS OF CASH FLOWS
The Pep Boys—Manny, Moe & Jack and Subsidiaries
(dollar amounts in thousands)
Year ended
February 2, February 3, January 28,
2008 2007 2006
Cash Flows from Operating Activities:
Net Loss ..................................................... $(41,039) $ (2,549) $ (37,528)
Adjustments to Reconcile Net Loss to Net Cash Provided by (Used in) Continuing Operations:
Net loss (earnings) from discontinued operations ........................... 3,601 (4,333) (1,088)
Depreciation and amortization ...................................... 81,036 87,525 78,949
Cumulative effect of change in accounting principle, net of tax ................... — (189) 2,021
Amortization of deferred gain from asset sales ............................ (1,030) — —
Accretion of asset disposal obligation .................................. 276 266 108
Loss on defeasance of convertible debt ................................. — 755 —
Stock compensation expense ....................................... 9,756 3,051 2,049
Inventory impairment ........................................... 32,803 — —
Cancellation of vested stock options ................................... — (1,056) —
Deferred income taxes .......................................... (28,187) (8,316) (27,792)
Reduction in asset retirement liability .................................. — — (1,815)
Gain from dispositions of assets ..................................... (15,151) (8,968) (4,826)
Loss from asset impairment ....................................... 7,199 840 4,200
Change in fair value of derivatives .................................... 9,268 (5,568) —
Excess tax benefits from stock based awards .............................. (1,104) (95) —
Increase in cash surrender value of life insurance policies ...................... (4,928) (2,143) (3,389)
Changes in operating assets and liabilities:
(Increase) decrease in accounts receivable, prepaid expenses and other .............. (1,579) 24,045 15,166
Decrease (increase) in merchandise inventories ............................ 13,087 9,250 (13,532)
(Decrease) increase in accounts payable ................................ (20,066) 3,549 (49,041)
Increase (decrease) in accrued expenses ................................ 10,083 (4,165) (18,864)
(Decrease) increase in other long-term liabilities ........................... (3,224) 2,093 16,760
Net Cash Provided by (Used in) Continuing Operations .......................... 50,801 93,992 (38,622)
Net Cash Provided by (Used in) Discontinued Operations ........................ 1,983 (1,562) 235
Net Cash Provided by (Used in) Operating Activities ............................. 52,784 92,430 (38,387)
Cash Flows from Investing Activities:
Cash paid for property and equipment ................................. (43,116) (49,391) (85,291)
Proceeds from dispositions of assets ................................... 162,712 10,561 4,043
Proceeds from sales of assets held for disposal ............................. — — 6,913
Life insurance proceeds received (paid) ................................. 30,045 (24,669) 24,655
Premiums paid on life insurance policies ................................ — — (605)
Net Cash Provided by (Used in) Continuing Operations .......................... 149,641 (63,499) (50,285)
Net Cash (Used in) Provided by Discontinued Operations ........................ (379) 6,160 262
Net Cash Provided by (Used in) Investing Activities ............................. 149,262 (57,339) (50,023)
Cash Flows from Financing Activities:
Borrowings under line of credit agreements .............................. 570,094 586,993 628,066
Payments under line of credit agreements ............................... (545,617) (635,562) (570,081)
Excess tax benefits from stock based awards .............................. 1,104 95 —
Borrowings on trade payable program liability ............................. 142,884 76,713 107,618
Payments on trade payable program liability .............................. (142,620) (73,879) (96,462)
Payments for finance issuance costs ................................... (85) (2,217) (5,150)
Proceeds from lease financing ...................................... 4,827 — —
Proceeds from issuance of notes ..................................... — 121,000 200,000
Reduction of long-term debt ....................................... (165,409) (2,263) (183,459)
Reduction of convertible debt ...................................... — (119,000) —
Payments on capital lease obligations .................................. (286) (227) (383)
Dividends paid ............................................... (14,177) (14,757) (14,686)
Repurchase of common stock ...................................... (58,152) — (15,562)
Proceeds from exercise of stock options ................................ 3,652 722 3,071
Proceeds from dividend reinvestment plan ............................... 781 894 961
Net Cash (Used in) Provided by Financing Activities ............................. (203,004) (61,488) 53,933
Net Decrease in Cash and Cash Equivalents .................................. (958) (26,397) (34,477)
Cash and Cash Equivalents at Beginning of Year ............................... 21,884 48,281 82,758
Cash and Cash Equivalents at End of Year ................................... $ 20,926 $ 21,884 $ 48,281
Cash paid for interest, net of amounts capitalized ............................... $ 44,129 $ 46,245 $ 50,602
Cash received from income tax refunds ..................................... $ 59 $ 1 $ 10,097
Cash paid for income taxes ............................................ $ 3,147 $ 632 $ 1,770
Supplemental Disclosure of Cash Flow Information:
Non-cash investing activities:
Accrued purchases of property and equipment ............................. $ 1,985 $ 3,691 $ 6,138
Write off of equipment and recognition of insurance receivable ................... $ — $ — $ 345
Non-cash financing activities:
Equipment capital leases ......................................... $ — $ 84 $ 789
Repurchase of common stock not settled ................................ $ — $ 7,311 $ —
See notes to the consolidated financial statements
38
10-K