Pep Boys 2007 Annual Report Download - page 117
Download and view the complete annual report
Please find page 117 of the 2007 Pep Boys annual report below. You can navigate through the pages in the report by either clicking on the pages listed below, or by using the keyword search tool below to find specific information within the annual report.-
 1
1 -
2
-
3
-
4
-
5
-
6
-
7
-
8
-
9
-
10
-
11
-
12
-
13
-
14
-
15
-
16
-
17
-
18
-
19
-
20
-
21
-
22
-
23
-
24
-
25
-
26
-
27
-
28
-
29
-
30
-
31
-
32
-
33
-
34
-
35
-
36
-
37
-
38
-
39
-
40
-
41
-
42
-
43
-
44
-
45
-
46
-
47
-
48
-
49
-
50
-
51
-
52
-
53
-
54
-
55
-
56
-
57
-
58
-
59
-
60
-
61
-
62
-
63
-
64
-
65
-
66
-
67
-
68
-
69
-
70
-
71
-
72
-
73
-
74
-
75
-
76
-
77
-
78
-
79
-
80
-
81
-
82
-
83
-
84
-
85
-
86
-
87
-
88
-
89
-
90
-
91
-
92
-
93
-
94
-
95
-
96
-
97
-
98
-
99
-
100
-
101
-
102
-
103
-
104
-
105
-
106
-
 107
107 -
 108
108 -
 109
109 -
 110
110 -
 111
111 -
 112
112 -
 113
113 -
 114
114 -
 115
115 -
 116
116 -
 117
117 -
 118
118 -
 119
119 -
 120
120 -
 121
121 -
 122
122 -
 123
123 -
 124
124 -
 125
125 -
 126
126 -
 127
127 -
128
-
129
-
130
-
131
-
132
-
133
-
134
-
135
-
136
-
137
-
138
-
139
-
140
-
141
-
142
-
143
-
144
-
145
-
146
-
147
-
148
 |
 |

THE PEP BOYS—MANNY, MOE & JACK AND SUBSIDIARIES
NOTES TO CONSOLIDATED FINANCIAL STATEMENTS (Continued)
Years ended February 2, 2008, February 3, 2007 and January 28, 2006
(dollar amounts in thousands, except share data)
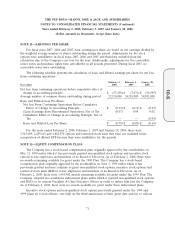
NOTE 11—EARNINGS PER SHARE
For fiscal years 2007, 2006 and 2005, basic earnings per share are based on net earnings divided by
the weighted average number of shares outstanding during the period. Adjustments for the stock
options were anti-dilutive in fiscal years 2007, 2006 and 2005 and therefore excluded from the
calculation due to the Company’s net loss for the year. Additionally, adjustments for the convertible
senior notes and purchase rights were anti-dilutive in all periods presented. During fiscal 2007, no
convertible notes were outstanding.
The following schedule presents the calculation of basic and diluted earnings per share for net loss
from continuing operations:
February 2, February 3, January 28,
Year ended 2008 2007 2006
Net loss from continuing operations before cumulative effect of
change in accounting principle ........................ $ (37,438) $ (7,071) $ (36,595)
Average number of common shares outstanding during period . . 52,130,000 54,318,000 54,831,000
Basic and Diluted Loss Per Share:
Net loss From Continuing Operations Before Cumulative
Effect of Change in Accounting Principle .............. $ (0.72) $ (0.13) $ (0.67)
(Loss) Earnings from Discontinued Operations, Net of Tax . . . (0.07) 0.08 0.02
Cumulative Effect of Change in Accounting Principle, Net of
Tax .......................................... — — (0.04)
Basic and Diluted Loss Per Share ...................... $ (0.79) $ (0.05) $ (0.69)
For the years ended February 2, 2008, February 3, 2007 and January 28, 2006, there were
3,347,089; 2,459,618 and 4,802,970 options and restricted stock units that were not included in the
computation of diluted EPS because they were antidilutive for the periods.
NOTE 12—EQUITY COMPENSATION PLANS
The Company has a stock-based compensation plan originally approved by the stockholders on
May 21, 1990 under which it has previously granted non-qualified stock options and incentive stock
options to key employees and members of its Board of Directors. As of February 2, 2008, there were
no awards remaining available for grant under the 1990 Plan. The Company has a stock-based
compensation plan originally approved by the stockholders on June 2, 1999 under which it has
previously granted and may continue to grant non-qualified stock options, incentive stock options and
restricted stock units (RSUs) to key employees and members of its Board of Directors. As of
February 2, 2008, there were 1,444,982 awards remaining available for grant under the 1999 Plan. The
Company adopted two standalone inducement plans under which it granted non-qualified stock options
and RSUs to its current President & Chief Executive Officer in order to induce him join the Company.
As of February 2, 2008, there were no awards available for grant under these inducement plans.
Incentive stock options and non-qualified stock options previously granted under the 1990 and
1999 plans (i) to non-officers, vest fully on the third anniversary of their grant date and (ii) to officers
71
10-K