Pep Boys 2007 Annual Report Download - page 74
Download and view the complete annual report
Please find page 74 of the 2007 Pep Boys annual report below. You can navigate through the pages in the report by either clicking on the pages listed below, or by using the keyword search tool below to find specific information within the annual report.-
 1
1 -
2
-
3
-
4
-
5
-
6
-
7
-
8
-
9
-
10
-
11
-
12
-
13
-
14
-
15
-
16
-
17
-
18
-
19
-
20
-
21
-
22
-
23
-
24
-
25
-
26
-
27
-
28
-
29
-
30
-
31
-
32
-
33
-
34
-
35
-
36
-
37
-
38
-
39
-
40
-
41
-
42
-
43
-
44
-
45
-
46
-
47
-
48
-
49
-
50
-
51
-
52
-
53
-
54
-
55
-
56
-
57
-
58
-
59
-
60
-
61
-
62
-
63
-
 64
64 -
 65
65 -
 66
66 -
 67
67 -
 68
68 -
 69
69 -
 70
70 -
 71
71 -
 72
72 -
 73
73 -
 74
74 -
 75
75 -
 76
76 -
 77
77 -
 78
78 -
 79
79 -
 80
80 -
 81
81 -
 82
82 -
 83
83 -
 84
84 -
85
-
86
-
87
-
88
-
89
-
90
-
91
-
92
-
93
-
94
-
95
-
96
-
97
-
98
-
99
-
100
-
101
-
102
-
103
-
104
-
105
-
106
-
107
-
108
-
109
-
110
-
111
-
112
-
113
-
114
-
115
-
116
-
117
-
118
-
119
-
120
-
121
-
122
-
123
-
124
-
125
-
126
-
127
-
128
-
129
-
130
-
131
-
132
-
133
-
134
-
135
-
136
-
137
-
138
-
139
-
140
-
141
-
142
-
143
-
144
-
145
-
146
-
147
-
148
 |
 |

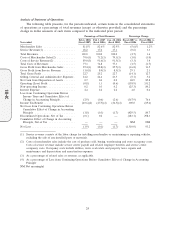
Industry Comparison
We operate in the U.S. automotive aftermarket, which has two general competitive arenas: the
Do-It-For-Me (‘‘DIFM’’) (service labor, installed merchandise and tires) market and the Do-It-Yourself
(‘‘DIY’’) (retail merchandise) market. Generally, the specialized automotive retailers focus on either
the ‘‘DIY’’ or ‘‘DIFM’’ areas of the business. We believe that operation in both the ‘‘DIY’’ and
‘‘DIFM’’ areas of the business positively differentiates us from most of our competitors. Although we
manage our store performance at a store level in aggregation, we believe that the following
presentation shows an accurate comparison against competitors within the two sales arenas. We
compete in the ‘‘DIY’’ area of the business through our retail sales floor and commercial sales business
(Retail Sales). Our Service Center business (labor and installed merchandise and tires) competes in the
‘‘DIFM’’ area of the industry. The following table presents the revenues and gross profit for each area
of the business.
Year ended
February 2, February 3, January 28,
(dollar amounts in thousands) 2008 2007 2006
Retail Sales(1) ..................................... $1,226,175 $1,336,330 $1,340,160
Service Center Revenue(2) ............................ 911,900 907,525 868,814
Total Revenues .................................... $2,138,075 $2,243,855 $2,208,974
Gross Profit from Retail Sales(3) ....................... $ 277,206 $ 377,897 $ 340,421
Gross Profit from Service Center Revenue(3) .............. 209,031 188,383 161,874
Total Gross Profit .................................. $ 486,237 $ 566,280 $ 502,295
(1) Excludes revenues from installed products.
(2) Includes revenues from installed products.
(3) Gross Profit from Retail Sales includes the cost of products sold, buying, warehousing and store
occupancy costs. Gross Profit from Service Center Revenue includes the cost of installed products
sold, buying, warehousing, service center payroll and related employee benefits and service center
occupancy costs. Occupancy costs include utilities, rents, real estate and property taxes, repairs and
maintenance and depreciation and amortization expenses.
Effects of Inflation
We use the LIFO method of inventory valuation. Thus, the cost of merchandise sold approximates
current cost. Although we cannot accurately determine the precise effect of inflation on its operations,
we do not believe inflation has had a material effect on revenues or results of operations during all
fiscal years presented.
CRITICAL ACCOUNTING POLICIES AND ESTIMATES
Management’s Discussion and Analysis of Financial Condition and Results of Operations discusses
our consolidated financial statements, which have been prepared in accordance with accounting
principles generally accepted in the United States of America. The preparation of these financial
statements requires management to make estimates and assumptions that affect the reported amounts
of assets and liabilities and the disclosure of contingent assets and liabilities at the date of the
consolidated financial statements and the reported amounts of revenues and expenses during the
reporting period. On an on-going basis, management evaluates its estimates and judgments, including
those related to customer incentives, product returns and warranty obligations, bad debts, inventories,
income taxes, financing operations, restructuring costs, retirement benefits, share based compensation,
28
10-K