Pep Boys 2007 Annual Report Download - page 109
Download and view the complete annual report
Please find page 109 of the 2007 Pep Boys annual report below. You can navigate through the pages in the report by either clicking on the pages listed below, or by using the keyword search tool below to find specific information within the annual report.-
 1
1 -
2
-
3
-
4
-
5
-
6
-
7
-
8
-
9
-
10
-
11
-
12
-
13
-
14
-
15
-
16
-
17
-
18
-
19
-
20
-
21
-
22
-
23
-
24
-
25
-
26
-
27
-
28
-
29
-
30
-
31
-
32
-
33
-
34
-
35
-
36
-
37
-
38
-
39
-
40
-
41
-
42
-
43
-
44
-
45
-
46
-
47
-
48
-
49
-
50
-
51
-
52
-
53
-
54
-
55
-
56
-
57
-
58
-
59
-
60
-
61
-
62
-
63
-
64
-
65
-
66
-
67
-
68
-
69
-
70
-
71
-
72
-
73
-
74
-
75
-
76
-
77
-
78
-
79
-
80
-
81
-
82
-
83
-
84
-
85
-
86
-
87
-
88
-
89
-
90
-
91
-
92
-
93
-
94
-
95
-
96
-
97
-
98
-
 99
99 -
 100
100 -
 101
101 -
 102
102 -
 103
103 -
 104
104 -
 105
105 -
 106
106 -
 107
107 -
 108
108 -
 109
109 -
 110
110 -
 111
111 -
 112
112 -
 113
113 -
 114
114 -
 115
115 -
 116
116 -
 117
117 -
 118
118 -
 119
119 -
120
-
121
-
122
-
123
-
124
-
125
-
126
-
127
-
128
-
129
-
130
-
131
-
132
-
133
-
134
-
135
-
136
-
137
-
138
-
139
-
140
-
141
-
142
-
143
-
144
-
145
-
146
-
147
-
148
 |
 |

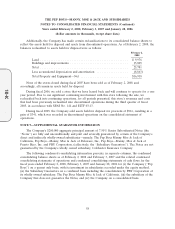
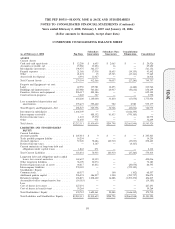
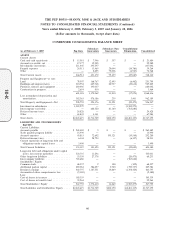
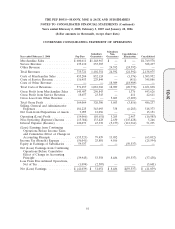
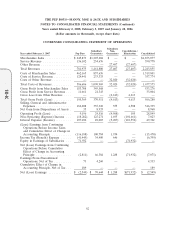
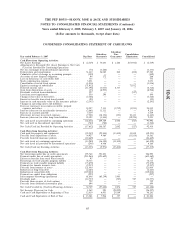
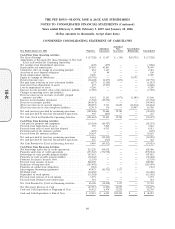
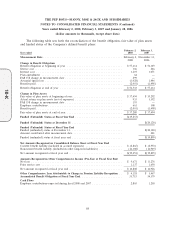
THE PEP BOYS—MANNY, MOE & JACK AND SUBSIDIARIES
NOTES TO CONSOLIDATED FINANCIAL STATEMENTS (Continued)
Years ended February 2, 2008, February 3, 2007 and January 28, 2006
(dollar amounts in thousands, except share data)
CONDENSED CONSOLIDATING STATEMENT OF OPERATIONS
Subsidiary
Subsidiary Non- Consolidation /
Year ended January 28, 2006 Pep Boys Guarantors Guarantors Elimination Consolidated
Merchandise Sales ............... $635,633 $1,194,999 $ — $ — $1,830,632
Service Revenue ................ 130,289 248,053 — — 378,342
Other Revenue ................. — — 29,500 (29,500) —
Total Revenues ................. 765,922 1,443,052 29,500 (29,500) 2,208,974
Costs of Merchandise Sales ........ 469,444 891,169 — — 1,360,613
Costs of Service Revenue .......... 117,820 228,246 — 346,066
Costs of Other Revenue ........... — — 34,188 (34,188) —
Total Costs of Revenues ........... 587,264 1,119,415 34,188 (34,188) 1,706,679
Gross Profit from Merchandise Sales . 166,189 303,830 — — 470,019
Gross Profit from Service Revenue . . . 12,469 19,807 — — 32,276
Gross Loss from Other Revenue .... — — (4,688) 4,688 —
Total Gross Profit (Loss) .......... 178,658 323,637 (4,688) 4,688 502,295
Selling, General and Administrative
Expenses .................... 175,633 338,952 327 4,688 519,600
Net (Loss) Gain from Dispositions of
Assets ...................... (675) 5,501 — — 4,826
Operating Profit (Loss) ........... 2,350 (9,814) (5,015) — (12,479)
Non-Operating (Expense) Income . . . (18,682) 92,005 575 (70,001) 3,897
Interest Expense (Income) ......... 88,928 33,987 (3,874) (70,001) 49,040
(Loss) Earnings from Continuing
Operations Before Income Taxes
and Cumulative Effect of Change in
Accounting Principle ........... (105,260) 48,204 (566) — (57,622)
Income Tax (Benefit) Expense ...... (37,144) 16,329 (212) — (21,027)
Equity in Earnings of Subsidiaries . . . 30,793 — — (30,793) —
Net (Loss) Earnings from Continuing
Operations Before Cumulative
Effect of Change in Accounting
Principle .................... (37,323) 31,875 (354) (30,793) (36,595)
Earnings From Discontinued
Operations, Net of Tax .......... 649 439 — — 1,088
Cumulative Effect of Change in
Accounting Principle, Net of Tax . . . (854) (1,167) — — (2,021)
Net (Loss) Earnings ............. $ (37,528) $ 31,147 $ (354) $(30,793) $ (37,528)
63
10-K