Pep Boys 2007 Annual Report Download - page 106
Download and view the complete annual report
Please find page 106 of the 2007 Pep Boys annual report below. You can navigate through the pages in the report by either clicking on the pages listed below, or by using the keyword search tool below to find specific information within the annual report.-
 1
1 -
2
-
3
-
4
-
5
-
6
-
7
-
8
-
9
-
10
-
11
-
12
-
13
-
14
-
15
-
16
-
17
-
18
-
19
-
20
-
21
-
22
-
23
-
24
-
25
-
26
-
27
-
28
-
29
-
30
-
31
-
32
-
33
-
34
-
35
-
36
-
37
-
38
-
39
-
40
-
41
-
42
-
43
-
44
-
45
-
46
-
47
-
48
-
49
-
50
-
51
-
52
-
53
-
54
-
55
-
56
-
57
-
58
-
59
-
60
-
61
-
62
-
63
-
64
-
65
-
66
-
67
-
68
-
69
-
70
-
71
-
72
-
73
-
74
-
75
-
76
-
77
-
78
-
79
-
80
-
81
-
82
-
83
-
84
-
85
-
86
-
87
-
88
-
89
-
90
-
91
-
92
-
93
-
94
-
95
-
 96
96 -
 97
97 -
 98
98 -
 99
99 -
 100
100 -
 101
101 -
 102
102 -
 103
103 -
 104
104 -
 105
105 -
 106
106 -
 107
107 -
 108
108 -
 109
109 -
 110
110 -
 111
111 -
 112
112 -
 113
113 -
 114
114 -
 115
115 -
 116
116 -
117
-
118
-
119
-
120
-
121
-
122
-
123
-
124
-
125
-
126
-
127
-
128
-
129
-
130
-
131
-
132
-
133
-
134
-
135
-
136
-
137
-
138
-
139
-
140
-
141
-
142
-
143
-
144
-
145
-
146
-
147
-
148
 |
 |
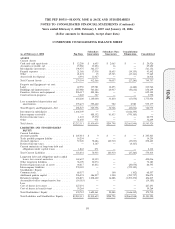
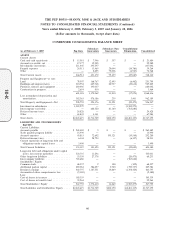
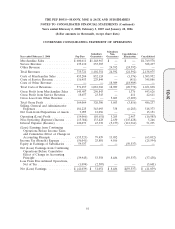
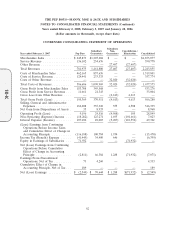
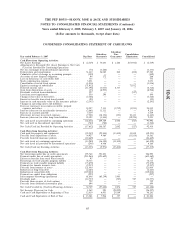
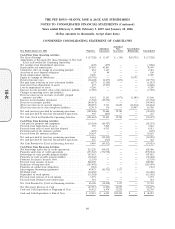
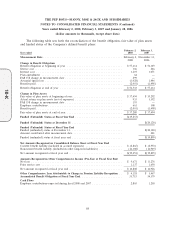
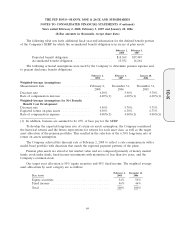
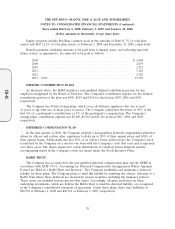
THE PEP BOYS—MANNY, MOE & JACK AND SUBSIDIARIES
NOTES TO CONSOLIDATED FINANCIAL STATEMENTS (Continued)
Years ended February 2, 2008, February 3, 2007 and January 28, 2006
(dollar amounts in thousands, except share data)
CONDENSED CONSOLIDATING BALANCE SHEET
Subsidiary Subsidiary Non- Consolidation/
As of February 3, 2007 Pep Boys Guarantors Guarantors Elimination Consolidated
ASSETS
Current Assets:
Cash and cash equivalents ............. $ 13,581 $ 7,946 $ 357 $ — $ 21,884
Accounts receivable, net ............... 17,377 12,205 — — 29,582
Merchandise inventories ............... 211,445 395,597 — — 607,042
Prepaid expenses ................... 24,511 13,469 20,044 (18,760) 39,264
Other .......................... — 2,255 75,038 (6,925) 70,368
Total Current Assets ................. 266,914 431,472 95,439 (25,685) 768,140
Property and Equipment—at cost:
Land........................... 78,507 166,767 12,893 (6,462) 251,705
Buildings and improvements ............ 310,952 607,948 20,937 (10,612) 929,225
Furniture, fixtures and equipment ......... 289,005 395,037 — — 684,042
Construction in progress ............... 2,654 810 — — 3,464
681,118 1,170,562 33,830 (17,074) 1,868,436
Less accumulated depreciation and
amortization ..................... 382,363 576,186 239 3,401 962,189
Total Property and Equipment—Net ....... 298,755 594,376 33,591 (20,475) 906,247
Investment in subsidiaries .............. 1,589,279 — — (1,589,279) —
Intercompany receivable ............... — 684,520 81,160 (765,680) —
Deferred income taxes ................ 24,828 — — — 24,828
Other .......................... 63,843 4,141 — — 67,984
Total Assets ....................... $2,243,619 $1,714,509 $210,190 $(2,401,119) $1,767,199
LIABILITIES AND STOCKHOLDERS’
EQUITY
Current Liabilities:
Accounts payable ................... $ 265,480 $ 9 $ — $ — $ 265,489
Trade payable program liability .......... 13,990 — — — 13,990
Accrued expenses ................... 43,815 72,692 195,321 (19,548) 292,280
Deferred income taxes ................ 6,344 28,724 — (6,137) 28,931
Current maturities of long-term debt and
obligations under capital leases ......... 3,490 — — — 3,490
Total Current Liabilities ............... 333,119 101,425 195,321 (25,685) 604,180
Long-term debt and obligations under capital
leases, less current maturities .......... 523,735 11,296 — — 535,031
Other long-term liabilities .............. 53,330 27,378 — (20,475) 60,233
Intercompany liabilities ............... 765,680 — — (765,680) —
Stockholders’ Equity:
Common stock ..................... 68,557 2 100 (102) 68,557
Additional paid-in capital .............. 289,384 386,857 3,900 (390,757) 289,384
Retained earnings ................... 463,797 1,187,551 10,869 (1,198,420) 463,797
Accumulated other comprehensive loss ..... (9,380) — — — (9,380)
Less:
Cost of shares in treasury .............. 185,339 — — — 185,339
Cost of shares in benefits trust ........... 59,264 — — — 59,264
Total Stockholders’ Equity ............. 567,755 1,574,410 14,869 (1,589,279) 567,755
Total Liabilities and Stockholders’ Equity .... $2,243,619 $1,714,509 $210,190 $(2,401,119) $1,767,199
60
10-K