Pep Boys 2007 Annual Report Download - page 81
Download and view the complete annual report
Please find page 81 of the 2007 Pep Boys annual report below. You can navigate through the pages in the report by either clicking on the pages listed below, or by using the keyword search tool below to find specific information within the annual report.-
 1
1 -
2
-
3
-
4
-
5
-
6
-
7
-
8
-
9
-
10
-
11
-
12
-
13
-
14
-
15
-
16
-
17
-
18
-
19
-
20
-
21
-
22
-
23
-
24
-
25
-
26
-
27
-
28
-
29
-
30
-
31
-
32
-
33
-
34
-
35
-
36
-
37
-
38
-
39
-
40
-
41
-
42
-
43
-
44
-
45
-
46
-
47
-
48
-
49
-
50
-
51
-
52
-
53
-
54
-
55
-
56
-
57
-
58
-
59
-
60
-
61
-
62
-
63
-
64
-
65
-
66
-
67
-
68
-
69
-
70
-
 71
71 -
 72
72 -
 73
73 -
 74
74 -
 75
75 -
 76
76 -
 77
77 -
 78
78 -
 79
79 -
 80
80 -
 81
81 -
 82
82 -
 83
83 -
 84
84 -
 85
85 -
 86
86 -
 87
87 -
 88
88 -
 89
89 -
 90
90 -
 91
91 -
92
-
93
-
94
-
95
-
96
-
97
-
98
-
99
-
100
-
101
-
102
-
103
-
104
-
105
-
106
-
107
-
108
-
109
-
110
-
111
-
112
-
113
-
114
-
115
-
116
-
117
-
118
-
119
-
120
-
121
-
122
-
123
-
124
-
125
-
126
-
127
-
128
-
129
-
130
-
131
-
132
-
133
-
134
-
135
-
136
-
137
-
138
-
139
-
140
-
141
-
142
-
143
-
144
-
145
-
146
-
147
-
148
 |
 |

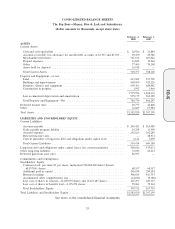
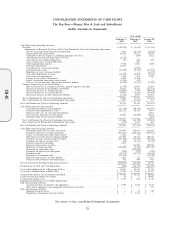
CONSOLIDATED BALANCE SHEETS
The Pep Boys—Manny, Moe & Jack and Subsidiaries
(dollar amounts in thousands, except share data)
February 2, February 3,
2008 2007
ASSETS
Current Assets:
Cash and cash equivalents ......................................... $ 20,926 $ 21,884
Accounts receivable, less allowance for uncollectible accounts of $1,937 and $1,505 . . . 29,450 29,582
Merchandise inventories ........................................... 561,152 607,042
Prepaid expenses ................................................ 43,842 39,264
Other ....................................................... 77,469 70,368
Assets held for disposal ........................................... 16,918 —
Total Current Assets ............................................. 749,757 768,140
Property and Equipment—at cost:
Land........................................................ 213,962 251,705
Buildings and improvements ........................................ 858,699 929,225
Furniture, fixtures and equipment .................................... 699,303 684,042
Construction in progress ........................................... 3,992 3,464
1,775,956 1,868,436
Less accumulated depreciation and amortization .......................... 995,177 962,189
Total Property and Equipment—Net .................................. 780,779 906,247
Deferred income taxes ............................................. 20,775 24,828
Other ......................................................... 32,609 67,984
Total Assets ..................................................... $1,583,920 $1,767,199
LIABILITIES AND STOCKHOLDERS’ EQUITY
Current Liabilities:
Accounts payable ............................................... $ 245,423 $ 265,489
Trade payable program liability ...................................... 14,254 13,990
Accrued expenses ............................................... 292,623 292,280
Deferred income taxes ............................................ — 28,931
Current maturities of long-term debt and obligations under capital lease .......... 2,114 3,490
Total Current Liabilities ........................................... 554,414 604,180
Long-term debt and obligations under capital leases, less current maturities ......... 400,016 535,031
Other long-term liabilities ........................................... 72,183 60,233
Deferred gain from asset sales ........................................ 86,595 —
Commitments and Contingencies
Stockholders’ Equity:
Common stock, par value $1 per share: Authorized 500,000,000 shares; Issued
68,557,041 shares .............................................. 68,557 68,557
Additional paid-in capital .......................................... 296,074 289,384
Retained earnings ............................................... 406,819 463,797
Accumulated other comprehensive loss ................................. (14,183) (9,380)
Less cost of shares in treasury—14,609,094 shares and 12,427,687 shares .......... 227,291 185,339
Less cost of shares in benefits trust—2,195,270 shares ....................... 59,264 59,264
Total Stockholders’ Equity ......................................... 470,712 567,755
Total Liabilities and Stockholders’ Equity ................................. $1,583,920 $1,767,199
See notes to the consolidated financial statements
35
10-K