Pep Boys 2007 Annual Report Download - page 126
Download and view the complete annual report
Please find page 126 of the 2007 Pep Boys annual report below. You can navigate through the pages in the report by either clicking on the pages listed below, or by using the keyword search tool below to find specific information within the annual report.-
 1
1 -
2
-
3
-
4
-
5
-
6
-
7
-
8
-
9
-
10
-
11
-
12
-
13
-
14
-
15
-
16
-
17
-
18
-
19
-
20
-
21
-
22
-
23
-
24
-
25
-
26
-
27
-
28
-
29
-
30
-
31
-
32
-
33
-
34
-
35
-
36
-
37
-
38
-
39
-
40
-
41
-
42
-
43
-
44
-
45
-
46
-
47
-
48
-
49
-
50
-
51
-
52
-
53
-
54
-
55
-
56
-
57
-
58
-
59
-
60
-
61
-
62
-
63
-
64
-
65
-
66
-
67
-
68
-
69
-
70
-
71
-
72
-
73
-
74
-
75
-
76
-
77
-
78
-
79
-
80
-
81
-
82
-
83
-
84
-
85
-
86
-
87
-
88
-
89
-
90
-
91
-
92
-
93
-
94
-
95
-
96
-
97
-
98
-
99
-
100
-
101
-
102
-
103
-
104
-
105
-
106
-
107
-
108
-
109
-
110
-
111
-
112
-
113
-
114
-
115
-
 116
116 -
 117
117 -
 118
118 -
 119
119 -
 120
120 -
 121
121 -
 122
122 -
 123
123 -
 124
124 -
 125
125 -
 126
126 -
 127
127 -
 128
128 -
 129
129 -
 130
130 -
 131
131 -
 132
132 -
 133
133 -
 134
134 -
 135
135 -
 136
136 -
137
-
138
-
139
-
140
-
141
-
142
-
143
-
144
-
145
-
146
-
147
-
148
 |
 |

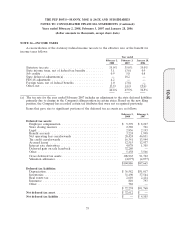
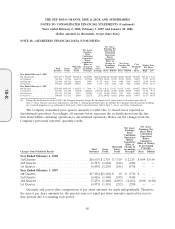
THE PEP BOYS—MANNY, MOE & JACK AND SUBSIDIARIES
NOTES TO CONSOLIDATED FINANCIAL STATEMENTS (Continued)
Years ended February 2, 2008, February 3, 2007 and January 28, 2006
(dollar amounts in thousands, except share data)
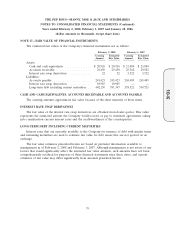
NOTE 18—QUARTERLY FINANCIAL DATA (UNAUDITED)
Net (Loss)
Earnings Per
Net (Loss) Share From
Earnings Continuing
From Operations
Continuing Before
Operations Cumulative
Before Effect of
Cumulative Change in Net (Loss)
Effect of Cash
Accounting Earnings Per Market Price
Operating Change in Net Dividends
Principle Share Per Share
Total Gross (Loss) Accounting (Loss) Per
Revenues Profit Profit Principle Earnings Basic Diluted Basic Diluted Share High Low
Year Ended February 2, 2008
4th Quarter(1) ............ $517,639 $ 99,006 $(13,544) $(18,505) $(20,403) $(0.36) $(0.36) $(0.40) $(0.40) $0.0675 $15.14 $ 8.25
3rd Quarter .............. 528,761 97,926 (36,139) (25,926) (27,990) (0.50) (0.50) (0.54) (0.54) 0.0675 17.97 13.50
2nd Quarter ............. 552,092 148,716 16,860 3,948 4,179 0.08 0.08 0.08 0.08 0.0675 22.49 15.90
1st Quarter .............. 539,583 140,589 15,838 3,050 3,175 0.06 0.06 0.06 0.06 0.0675 19.93 14.73
Year Ended February 3, 2007
4th Quarter .............. $578,950 $148,834 $ 18,150 $ 7,936 $ 7,716 $ 0.15 $ 0.15 $ 0.14 $ 0.14 $0.0675 $16.05 $12.48
3rd Quarter .............. 543,923 136,289 (1,592) (10,881) (10,914) (0.20) (0.20) (0.20) (0.20) 0.0675 14.58 9.33
2nd Quarter ............. 571,312 143,622 5,297 (2,993) 1,352 (0.06) (0.05) 0.03 0.03 0.0675 14.96 10.66
1st Quarter .............. 549,668 137,533 6,990 (1,117) (703) (0.02) (0.02) (0.01) (0.01) 0.0675 16.55 14.05
(1) During the fourth quarter of fiscal 2007, the Company incurred charges for the closure of 31 stores, which is described more fully in
Note 7—Store Closures and Asset Impairments and Note 8—Discontinued Operations. In addition, the Company sold the land and buildings
for 34 owned properties to an independent third party, which is described more fully in Note 5—Lease and Other Commitments.
The Company reclassified prior quarter amounts to reflect the 11 closed stores reported as
discontinued operations. Accordingly, all amounts below represent the reclassification from the line
item listed within continuing operations to discontinued operations. Below are the changes from the
Company’s previously reported, quarterly results:
Net (Loss)
Net (Loss) Earnings Per
Earnings Share From
From Continuing
Continuing Operations
Operations Before
Before Cumulative
Cumulative Effect of Change
Effect of in Accounting
Operating Change in Principle
Total Gross (Loss) Accounting
Changes from Published Results Revenues Profit Profit Principle Basic Diluted
Year Ended February 2, 2008
3rd Quarter ............................. $(6,615) $ 2,318 $ 3,310 $ 2,215 $ 0.04 $ 0.04
2nd Quarter ............................. (6,797) (1,422) (418) (248) — —
1st Quarter .............................. (6,430) (1,203) (241) (170) — —
Year Ended February 3, 2007
4th Quarter ............................. $(7,196) $(1,249) $ 10 $ (174) $ —
3rd Quarter ............................. (6,926) (1,404) (243) (168) — —
2nd Quarter ............................. (7,253) (1,480) (6,692) (4,463) (0.09) (0.08)
1st Quarter .............................. (6,933) (1,345) (252) (250) — —
Quarterly and year-to-date computations of per share amounts are made independently. Therefore,
the sum of per share amounts for the quarters may not equal per share amounts reported for year-to-
date periods due to rounding each period.
80
10-K