Pep Boys 2007 Annual Report Download - page 105
Download and view the complete annual report
Please find page 105 of the 2007 Pep Boys annual report below. You can navigate through the pages in the report by either clicking on the pages listed below, or by using the keyword search tool below to find specific information within the annual report.-
 1
1 -
2
-
3
-
4
-
5
-
6
-
7
-
8
-
9
-
10
-
11
-
12
-
13
-
14
-
15
-
16
-
17
-
18
-
19
-
20
-
21
-
22
-
23
-
24
-
25
-
26
-
27
-
28
-
29
-
30
-
31
-
32
-
33
-
34
-
35
-
36
-
37
-
38
-
39
-
40
-
41
-
42
-
43
-
44
-
45
-
46
-
47
-
48
-
49
-
50
-
51
-
52
-
53
-
54
-
55
-
56
-
57
-
58
-
59
-
60
-
61
-
62
-
63
-
64
-
65
-
66
-
67
-
68
-
69
-
70
-
71
-
72
-
73
-
74
-
75
-
76
-
77
-
78
-
79
-
80
-
81
-
82
-
83
-
84
-
85
-
86
-
87
-
88
-
89
-
90
-
91
-
92
-
93
-
94
-
 95
95 -
 96
96 -
 97
97 -
 98
98 -
 99
99 -
 100
100 -
 101
101 -
 102
102 -
 103
103 -
 104
104 -
 105
105 -
 106
106 -
 107
107 -
 108
108 -
 109
109 -
 110
110 -
 111
111 -
 112
112 -
 113
113 -
 114
114 -
 115
115 -
116
-
117
-
118
-
119
-
120
-
121
-
122
-
123
-
124
-
125
-
126
-
127
-
128
-
129
-
130
-
131
-
132
-
133
-
134
-
135
-
136
-
137
-
138
-
139
-
140
-
141
-
142
-
143
-
144
-
145
-
146
-
147
-
148
 |
 |
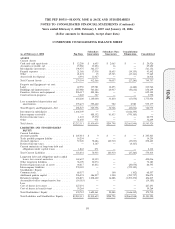
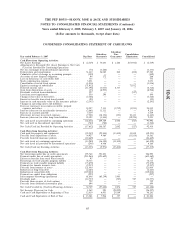
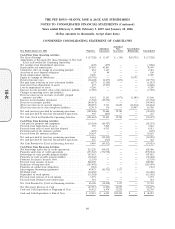
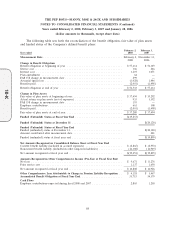
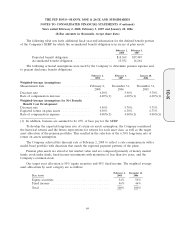
THE PEP BOYS—MANNY, MOE & JACK AND SUBSIDIARIES
NOTES TO CONSOLIDATED FINANCIAL STATEMENTS (Continued)
Years ended February 2, 2008, February 3, 2007 and January 28, 2006
(dollar amounts in thousands, except share data)
CONDENSED CONSOLIDATING BALANCE SHEET
Subsidiary Subsidiary Non- Consolidation/
As of February 2, 2008 Pep Boys Guarantors Guarantors Elimination Consolidated
ASSETS
Current Assets:
Cash and cash equivalents ............. $ 12,208 $ 6,655 $ 2,063 $ — $ 20,926
Accounts receivable, net ............... 15,580 13,854 16 — 29,450
Merchandise inventories ............... 198,975 362,177 — — 561,152
Prepaid expenses ................... 21,368 17,938 18,655 (14,119) 43,842
Other .......................... 21,272 15 69,323 (13,141) 77,469
Assets held for disposal ............... 4,991 11,927 — — 16,918
Total Current Assets ................. 274,394 412,566 90,057 (27,260) 749,757
Property and Equipment—at cost:
Land........................... 67,550 139,981 12,893 (6,462) 213,962
Buildings and improvements ............ 287,088 561,286 20,937 (10,612) 858,699
Furniture, fixtures and equipment ......... 296,117 403,186 — — 699,303
Construction in progress ............... 3,445 547 — — 3,992
654,200 1,105,000 33,830 (17,074) 1,775,956
Less accumulated depreciation and
amortization ..................... 395,673 595,602 922 2,980 995,177
Total Property and Equipment—Net ....... 258,527 509,398 32,908 (20,054) 780,779
Investment in subsidiaries .............. 1,646,349 — — (1,646,349) —
Intercompany receivable ............... — 888,352 81,833 (970,185) —
Deferred income taxes ................ 1,403 19,372 — — 20,775
Other .......................... 31,638 971 — — 32,609
Total Assets ....................... $2,212,311 $1,830,659 $204,798 $(2,663,848) $1,583,920
LIABILITIES AND STOCKHOLDERS’
EQUITY
Current Liabilities:
Accounts payable ................... $ 245,414 $ 9 $ — $ — $ 245,423
Trade payable program liability .......... 14,254 — — — 14,254
Accrued expenses ................... 57,320 70,486 183,910 (19,093) 292,623
Deferred income taxes ................ — 8,167 — (8,167) —
Current maturities of long-term debt and
obligations under capital leases ......... 1,843 271 — — 2,114
Total Current Liabilities ............... 318,831 78,933 183,910 (27,260) 554,414
Long-term debt and obligations under capital
leases, less current maturities .......... 369,657 30,359 — — 400,016
Other long-term liabilities .............. 38,109 34,074 — — 72,183
Deferred gain from sale of assets ......... 44,817 61,832 — (20,054) 86,595
Intercompany liabilities ............... 970,185 — — (970,185) —
Stockholders’ Equity:
Common stock ..................... 68,557 2 100 (102) 68,557
Additional paid-in capital .............. 296,074 386,857 3,900 (390,757) 296,074
Retained earnings ................... 406,819 1,238,602 16,888 (1,255,490) 406,819
Accumulated other comprehensive loss ..... (14,183) — — — (14,183)
Less:
Cost of shares in treasury .............. 227,291 — — — 227,291
Cost of shares in benefits trust ........... 59,264 — — — 59,264
Total Stockholders’ Equity ............. 470,712 1,625,461 20,888 (1,646,349) 470,712
Total Liabilities and Stockholders’ Equity .... $2,212,311 $1,830,659 $204,798 $(2,663,848) $1,583,920
59
10-K