Pep Boys 2007 Annual Report Download - page 111
Download and view the complete annual report
Please find page 111 of the 2007 Pep Boys annual report below. You can navigate through the pages in the report by either clicking on the pages listed below, or by using the keyword search tool below to find specific information within the annual report.-
 1
1 -
2
-
3
-
4
-
5
-
6
-
7
-
8
-
9
-
10
-
11
-
12
-
13
-
14
-
15
-
16
-
17
-
18
-
19
-
20
-
21
-
22
-
23
-
24
-
25
-
26
-
27
-
28
-
29
-
30
-
31
-
32
-
33
-
34
-
35
-
36
-
37
-
38
-
39
-
40
-
41
-
42
-
43
-
44
-
45
-
46
-
47
-
48
-
49
-
50
-
51
-
52
-
53
-
54
-
55
-
56
-
57
-
58
-
59
-
60
-
61
-
62
-
63
-
64
-
65
-
66
-
67
-
68
-
69
-
70
-
71
-
72
-
73
-
74
-
75
-
76
-
77
-
78
-
79
-
80
-
81
-
82
-
83
-
84
-
85
-
86
-
87
-
88
-
89
-
90
-
91
-
92
-
93
-
94
-
95
-
96
-
97
-
98
-
99
-
100
-
 101
101 -
 102
102 -
 103
103 -
 104
104 -
 105
105 -
 106
106 -
 107
107 -
 108
108 -
 109
109 -
 110
110 -
 111
111 -
 112
112 -
 113
113 -
 114
114 -
 115
115 -
 116
116 -
 117
117 -
 118
118 -
 119
119 -
 120
120 -
 121
121 -
122
-
123
-
124
-
125
-
126
-
127
-
128
-
129
-
130
-
131
-
132
-
133
-
134
-
135
-
136
-
137
-
138
-
139
-
140
-
141
-
142
-
143
-
144
-
145
-
146
-
147
-
148
 |
 |

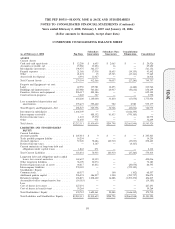
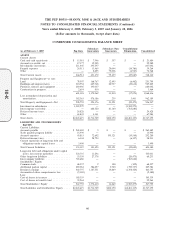
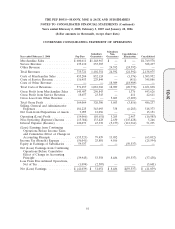
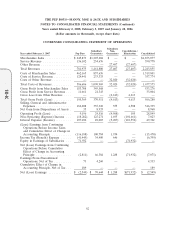
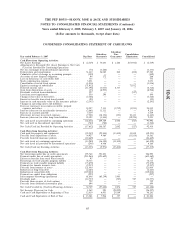
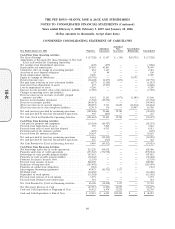
THE PEP BOYS—MANNY, MOE & JACK AND SUBSIDIARIES
NOTES TO CONSOLIDATED FINANCIAL STATEMENTS (Continued)
Years ended February 2, 2008, February 3, 2007 and January 28, 2006
(dollar amounts in thousands, except share data)
CONDENSED CONSOLIDATING STATEMENT OF CASH FLOWS
Subsidiary
Subsidiary Non- Consolidation
Year ended February 3, 2007 Pep Boys Guarantors Guarantors Elimination Consolidated
Cash Flows from Operating Activities:
Net (Loss) Earnings ........................ $ (2,549) $ 70,644 $ 1,288 $(71,932) $ (2,549)
Adjustments to Reconcile Net (Loss) Earnings to Net Cash
(Used in) Provided By Continuing Operations:
Net loss (earnings) from discontinued operations ...... (73) (4,260) — — (4,333)
Depreciation and amortization .................. 31,440 56,085 240 (240) 87,525
Cumulative effect of change in accounting principle ..... (189) — — — (189)
Accretion of asset disposal obligation .............. 94 172 — — 266
Loss on defeasance of convertible debt ............. 755 — — — 755
Stock compensation expense ................... 3,051 — — — 3,051
Cancellation of vested stock options .............. (1,056) — — — (1,056)
Equity in earnings of subsidiaries ................ (71,932) — — 71,932 —
Deferred income taxes ....................... (11,598) (3,055) 6,337 — (8,316)
Gain from dispositions of assets ................. (35) (8,933) — — (8,968)
Dividends received from subsidiaries .............. 527 — — (527) —
Loss from asset impairment .................... 550 290 — — 840
Change in fair value of derivatives ............... (5,568) — — — (5,568)
Excess tax benefits from stock based awards ......... (95) — — — (95)
Increase in cash surrender value of life insurance policies . (2,143) — — — (2,143)
Changes in operating assets and liabilities:
Decrease (increase) in accounts receivable, prepaid
expenses and other ........................ 24,587 7,113 (5,712) (1,943) 24,045
Increase (decrease) in merchandise inventories ........ (2,061) 11,311 — — 9,250
Increase in accounts payable ................... 3,549 — — — 3,549
(Decrease) increase in accrued expenses ............ (7,301) (18,154) (151) 21,441 (4,165)
Increase (decrease) in other long-term liabilities ....... 23,195 (1,844) — (19,258) 2,093
Net cash (used in) provided by continuing operations . . . . (16,852) 109,369 2,002 (527) 93,992
Net cash used in discontinued operations ........... (780) (782) — — (1,562)
Net Cash (Used in) Provided by Operating Activities . . . . (17,632) 108,587 2,002 (527) 92,430
Cash Flows from Investing Activities:
Cash paid for property and equipment ............ (23,547) (25,844) (33,830) 33,830 (49,391)
Proceeds from dispositions of assets ............... 34,927 9,464 — (33,830) 10,561
Proceeds from life insurance policies .............. (24,669) — — — (24,669)
Net cash (used in) continuing operations ............ (13,289) (16,380) (33,830) — (63,499)
Net cash (used in) provided by discontinued operations . . (246) 6,406 — — 6,160
Net Cash (Used in) Investing Activities ............ (13,535) (9,974) (33,830) — (57,339)
Cash Flows from Financing Activities:
Net borrowings under line of credit agreements ....... 195,762 391,231 — — 586,993
Payments under line of credit agreements ........... (211,960) (423,602) — — (635,562)
Excess tax benefits from stock based awards ......... 95 — — — 95
Borrowings on trade payable program liability ........ 76,713 — — — 76,713
Payments on trade payable program liability ......... (73,879) — — — (73,879)
Payments for finance issuance costs ............... (2,217) — — — (2,217)
Proceeds from issuance of notes ................. 121,000 — — — 121,000
Reduction of long-term debt ................... (2,263) — — — (2,263)
Reduction of convertible debt .................. (119,000) — — — (119,000)
Payments on capital lease obligations .............. (227) — — — (227)
Intercompany borrowings (payments) .............. 61,846 (65,249) 3,403 — —
Dividends paid ............................ (14,757) — (527) 527 (14,757)
Proceeds from exercise of stock options ............ 722 — — — 722
Proceeds from dividend reinvestment plan ........... 894 — — — 894
Net Cash Provided by (Used in) Financing Activities . . . . 32,729 (97,620) 2,876 527 (61,488)
Net Increase (Decrease) in Cash ................. 1,562 993 (28,952) — (26,397)
Cash and Cash Equivalents at Beginning of Year ...... 12,019 6,953 29,309 — 48,281
Cash and Cash Equivalents at End of Year .......... $ 13,581 $ 7,946 $ 357 $ — $ 21,884
65
10-K