Pep Boys 2007 Annual Report Download - page 71
Download and view the complete annual report
Please find page 71 of the 2007 Pep Boys annual report below. You can navigate through the pages in the report by either clicking on the pages listed below, or by using the keyword search tool below to find specific information within the annual report.-
 1
1 -
2
-
3
-
4
-
5
-
6
-
7
-
8
-
9
-
10
-
11
-
12
-
13
-
14
-
15
-
16
-
17
-
18
-
19
-
20
-
21
-
22
-
23
-
24
-
25
-
26
-
27
-
28
-
29
-
30
-
31
-
32
-
33
-
34
-
35
-
36
-
37
-
38
-
39
-
40
-
41
-
42
-
43
-
44
-
45
-
46
-
47
-
48
-
49
-
50
-
51
-
52
-
53
-
54
-
55
-
56
-
57
-
58
-
59
-
60
-
 61
61 -
 62
62 -
 63
63 -
 64
64 -
 65
65 -
 66
66 -
 67
67 -
 68
68 -
 69
69 -
 70
70 -
 71
71 -
 72
72 -
 73
73 -
 74
74 -
 75
75 -
 76
76 -
 77
77 -
 78
78 -
 79
79 -
 80
80 -
 81
81 -
82
-
83
-
84
-
85
-
86
-
87
-
88
-
89
-
90
-
91
-
92
-
93
-
94
-
95
-
96
-
97
-
98
-
99
-
100
-
101
-
102
-
103
-
104
-
105
-
106
-
107
-
108
-
109
-
110
-
111
-
112
-
113
-
114
-
115
-
116
-
117
-
118
-
119
-
120
-
121
-
122
-
123
-
124
-
125
-
126
-
127
-
128
-
129
-
130
-
131
-
132
-
133
-
134
-
135
-
136
-
137
-
138
-
139
-
140
-
141
-
142
-
143
-
144
-
145
-
146
-
147
-
148
 |
 |

Fiscal 2007 vs. Fiscal 2006
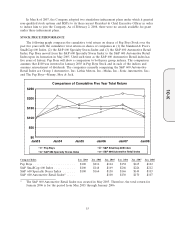
Total revenues for fiscal 2007 decreased 4.7% to $2,138,075,000 in fiscal 2007 from $2,243,855,000.
This decrease was primarily the result of weaker sales in our retail business stemming from lower
customer counts and the de-emphasis of non-core automotive merchandise. On a 52-week basis,
comparable revenues decreased by 3.1%, consisting of a 1.8% increase in comparable service revenue
and a 4.2% decrease in comparable merchandise sales. All stores included in the comparable sales
store base as of the end of the period are included in the comparable sales data calculations. Upon
reaching its 13th month of operation, a store is added to our comparable sales store base. Stores are
removed from the comparables sales store base upon their relocation or closure. Once a relocated store
reaches its 13th month of operation at its new location, it is added back into our comparable sales store
base. Square footage increases are infrequent and immaterial and, accordingly are not considered in
our calculations of comparable sales data.
Gross profit from merchandise sales decreased, as a percentage of merchandise sales, to 25.4% in
fiscal 2007 from 28.8% in fiscal 2006. This decrease in dollars was $89,650,000 or a 16.8% decrease
from the prior year. This decrease, as a percentage of merchandise sales, resulted primarily from
decreased product margins, higher occupancy costs and higher rent expense offset, in part, by lower
warehousing and distribution costs. The 2.5% decrease in product margins resulted from recording a
$32,803,000 inventory impairment charge associated with the markdown and discontinuance of certain
non core products as part of our longer term-strategic plan. Occupancy costs increased by $7,242,000
primarily due to the impairment charges of $5,350,000 related to the 20 stores identified for closure
that operated as clearance centers during the fourth quarter and rent expense increased by $4,128,000
primarily related to the change in fair value of the cash flow hedge associated with variable lease
payments on certain of stores, partially offset by lower equipment rental. Warehousing and distribution
costs decreased by $7,083,000 due to a more efficient store replenishment schedule and lower
occupancy costs.
Gross profit from service revenue increased, as a percentage of service revenue, to 11.0% in fiscal
2007 from 8.4% in fiscal 2006. The increase in dollars was $9,607,000 or a 29.1% increase from the
prior year. This increase as a percentage of service revenue resulted primarily from lower service
associate costs (positive experience in workers compensation and medical claims) of $15,124,000,
partially offset by higher service associate compensation expense resulting from increased staffing levels
in our service centers and impairment charges of $1,849,000 related to the 20 closed stores.
Selling, general and administrative expenses, as a percentage of total revenues, decreased to 24.2%
for fiscal 2007 as compared to 24.4% for fiscal 2006. This decrease in dollars was $28,026,000 or 5.1%
over the prior year. The dollar decrease resulted primarily from lower retail associate compensation
expense of $15,744,000, lower retail associate costs of $8,349,000 (workers compensation and medical)
and reduced media expenditures of $5,700,000, partially offset by increased legal settlements and
reserves.
Net gain from disposition of assets increased, as a percentage of total revenue, to 0.7% for fiscal
2007 as compared to 0.4% for fiscal 2006. The $6,183,000 increase resulted from the $13,971,000 gain
realized upon the consummation of our 34 store sale leaseback transaction which was required to be
immediately recognized (the remaining portion will be amortized over the lease term).
Interest expense increased $1,951,000 or 4.0% to $51,293,000 in fiscal 2007 from $49,342,000 in
fiscal 2006. Included in fiscal 2007 was $5,900,000 in expense incurred due to the write off of deferred
financing costs resulting from the repayment of $162,558,000 of our Senior Secured Term Loan facility
and the reclassification from other comprehensive loss for the portion of the related interest rate swap
that is no longer designated as a hedge. Included in fiscal 2006 was $4,200,000 of expense associated
25
10-K