Pep Boys 2007 Annual Report Download - page 65
Download and view the complete annual report
Please find page 65 of the 2007 Pep Boys annual report below. You can navigate through the pages in the report by either clicking on the pages listed below, or by using the keyword search tool below to find specific information within the annual report.
$116,318,000 purchase price, which will allow us to fund such obligation through sale-leaseback or other
financing transactions.
We anticipate that cash provided by operating activities, our existing line of credit, cash on hand,
additional sale-leaseback financing transactions, and future access to the capital markets will exceed our
expected cash requirement in fiscal 2008.
Our working capital was $195,343,000 at February 2, 2008, $163,960,000 at February 3, 2007 and
$247,526,000 at January 28, 2006. Our long-term debt, as a percentage of its total capitalization, was
46% at February 2, 2008, 49% at February 3, 2007 and 50% at January 28, 2006, respectively. As of
February 2, 2008, we had a $357,500,000 line of credit, with an availability of approximately
$131,000,000. Our current portion of long term debt is $2,114,000 at February 2, 2008.
Contractual Obligations
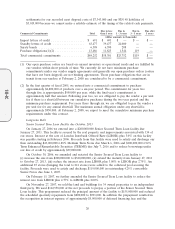
The following chart represents our total contractual obligations and commercial commitments as of
February 2, 2008:
Due in less Due in Due in Due after
Contractual Obligations Total than 1 year 1 - 3 years 3 - 5 years 5 years
(dollars in thousands)
Long-term debt(1) ................... $ 396,945 $ 1,585 $ 45,217 $ 3,180 $346,963
Operating leases ..................... 584,965 68,240 117,849 108,515 290,361
Asset purchase obligation under operating
lease(2) .......................... 116,318 116,318 — — —
Expected scheduled interest payments on all
long-term debt, capital leases and lease
finance obligations .................. 173,855 29,074 57,741 51,150 35,890
Capital and lease financing obligations(1) . . . 5,185 529 647 551 3,458
Other long-term obligations(3) .......... 31,618 2,865 — — —
Total contractual obligations ............ $1,308,886 $218,611 $221,454 $163,396 $676,672
(1) Long-term debt, capital leases and lease financing obligations include current maturities.
(2) We have exercised an option to purchase, on or before August 1, 2008, 29 properties that we
currently rent under a master operating lease. We believe that the market value of these properties
exceeds their $116,318,000 purchase price, which will allow us to fund such purchase through
sale-leasebacks or other financing transactions.
(3) Primarily includes unfunded pension obligation of $19,253,000, FIN 48 liabilities and asset
retirement obligations. We made voluntary contributions of $440,000; $504,000 and $1,867,000, to
our pension plans in fiscal 2007, 2006 and 2005, respectively. Future plan contributions are
dependent upon actual plan asset returns and interest rates. See Note 10 of Notes to Consolidated
Financial Statements in ‘‘Item 8. Financial Statements and Supplementary Data’’ for further
discussion of our pension plans. The above table does not reflect the timing of projected
19
10-K


