Pep Boys 2007 Annual Report Download - page 62
Download and view the complete annual report
Please find page 62 of the 2007 Pep Boys annual report below. You can navigate through the pages in the report by either clicking on the pages listed below, or by using the keyword search tool below to find specific information within the annual report.-
 1
1 -
2
-
3
-
4
-
5
-
6
-
7
-
8
-
9
-
10
-
11
-
12
-
13
-
14
-
15
-
16
-
17
-
18
-
19
-
20
-
21
-
22
-
23
-
24
-
25
-
26
-
27
-
28
-
29
-
30
-
31
-
32
-
33
-
34
-
35
-
36
-
37
-
38
-
39
-
40
-
41
-
42
-
43
-
44
-
45
-
46
-
47
-
48
-
49
-
50
-
51
-
 52
52 -
 53
53 -
 54
54 -
 55
55 -
 56
56 -
 57
57 -
 58
58 -
 59
59 -
 60
60 -
 61
61 -
 62
62 -
 63
63 -
 64
64 -
 65
65 -
 66
66 -
 67
67 -
 68
68 -
 69
69 -
 70
70 -
 71
71 -
 72
72 -
73
-
74
-
75
-
76
-
77
-
78
-
79
-
80
-
81
-
82
-
83
-
84
-
85
-
86
-
87
-
88
-
89
-
90
-
91
-
92
-
93
-
94
-
95
-
96
-
97
-
98
-
99
-
100
-
101
-
102
-
103
-
104
-
105
-
106
-
107
-
108
-
109
-
110
-
111
-
112
-
113
-
114
-
115
-
116
-
117
-
118
-
119
-
120
-
121
-
122
-
123
-
124
-
125
-
126
-
127
-
128
-
129
-
130
-
131
-
132
-
133
-
134
-
135
-
136
-
137
-
138
-
139
-
140
-
141
-
142
-
143
-
144
-
145
-
146
-
147
-
148
 |
 |

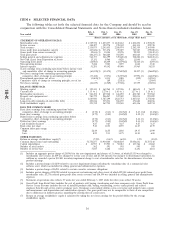
ITEM 6 SELECTED FINANCIAL DATA
The following tables set forth the selected financial data for the Company and should be read in
conjunction with the Consolidated Financial Statements and Notes thereto included elsewhere herein.
Feb. 2, Feb. 3, Jan. 28, Jan. 29, Jan. 31,
Year ended 2008 2007 2006 2005 2004
(dollar amounts are in thousands, except share data)
STATEMENT OF OPERATIONS DATA(5)
Merchandise sales ............................. $1,749,578 $ 1,853,077 $ 1,830,632 $ 1,838,258 $ 1,705,670
Service revenue .............................. 388,497 390,778 378,342 404,101 399,738
Total revenues ............................... 2,138,075 2,243,855 2,208,974 2,242,359 2,105,408
Gross profit from merchandise sales(6) ................ 443,626 (1) 533,276 470,019 510,583 479,020 (4)
Gross profit from service revenue(6) ................. 42,611 (1) 33,004 32,276 92,245 94,149 (4)
Total gross profit ............................. 486,237 (1) 566,280 502,295 602,828 573,169 (4)
Selling, general and administrative expenses ............. 518,373 546,399 519,600 (2) 542,228 (3) 564,815 (4)
Net Gain (Loss) from Disposition of Assets ............. 15,151 8,968 4,826 11,848 (61)
Operating (loss) profit .......................... (16,985) 28,849 (12,479)(2) 72,448 (3) 8,293 (4)
Non-operating income .......................... 5,246 7,023 3,897 1,824 3,340
Interest expense .............................. 51,293 49,342 49,040 35,965 38,255
(Loss) earnings from continuing operations before income taxes
and cumulative effect of change in accounting principle .... (63,032)(1) (13,470) (57,622)(2) 38,307 (3) (26,622)(4)
Net (loss) earnings from continuing operations before
cumulative effect of change in accounting principle ....... (37,438) (7,071) (36,595)(2) 23,991 (3) (16,827)(4)
Discontinued operations, net of tax .................. (3,601)(1) 4,333 1,088 (412) (14,583)
Cumulative effect of change in accounting principle, net of tax . — 189 (2,021) — (2,484)
Net (loss) earnings ............................ (41,039) (2,549) (37,528) 23,579 (33,894)
BALANCE SHEET DATA
Working capital .............................. $ 195,343 $ 163,960 $ 247,526 $ 180,651 $ 76,227
Current ratio ................................ 1.35 to 1 1.27 to 1 1.43 to 1 1.27 to 1 1.10 to 1
Merchandise inventories ......................... $ 561,152 $ 607,042 $ 616,292 $ 602,760 $ 553,562
Property and equipment-net ....................... 780,779 906,247 947,389 945,031 923,209
Total assets ................................. 1,583,920 1,767,199 1,821,753 1,867,023 1,778,046
Long-term debt (includes all convertible debt) ........... 400,016 535,031 586,239 471,682 408,016
Total stockholders’ equity ........................ 470,712 567,755 594,565 653,456 569,734
DATA PER COMMON SHARE
Basic (loss) earnings from continuing operations before
cumulative effect of change in accounting principle ....... $ (0.72) $ (0.13) $ (0.67)(2) $ 0.43 (3)$ (0.32)(4)
Basic (loss) earnings ........................... (0.79) (0.05) (0.69)(2) 0.42 (3) (0.65)(4)
Diluted (loss) earnings from continuing operations before
cumulative effect of change in accounting principle ....... (0.72) (0.13) (0.67)(2) 0.42 (3) (0.32)(4)
Diluted net (loss) earnings ....................... (0.79) (0.05) (0.69)(2) 0.41 (3) (0.65)(4)
Cash dividends declared ......................... 0.27 0.27 0.27 0.27 0.27
Book value per share ........................... 9.10 10.53 10.97 11.87 10.79
Common share price range:
High ................................... 22.49 16.55 18.80 29.37 23.99
Low.................................... 8.25 9.33 11.75 11.83 6.00
OTHER STATISTICS
Return on average stockholders’ equity(7) .............. (7.9)% (0.4)% (6.0)% 3.9% (5.8)%
Common shares issued and outstanding ............... 51,752,677 53,934,084 54,208,803 55,056,641 52,787,148
Capital expenditures ........................... $ 41,953 $ 53,903 $ 92,083 $ 103,766 $ 43,262
Number of retail outlets ......................... 562 593 593 595 595
Number of service bays ......................... 5,845 6,162 6,162 6,181 6,181
(1) Includes an aggregate pretax charge of $10,963 for the asset impairment and closure of 31 stores, of which $5,350 was charged to
merchandise cost of sales, $1,849 was charged to service cost of sales and $3,764 (pretax) was charged to discontinued operations. In
addition we recorded a pretax $32,803 inventory impairment charge to cost of merchandise sales for the discontinuance of certain
product offerings.
(2) Includes a pretax charge of $4,200 related to an asset impairment charge reflecting the remaining value of a commercial sales
software asset, which was included in selling, general and administrative expenses.
(3) Includes a pretax charge of $6,911 related to certain executive severance obligations.
(4) Includes pretax charges of $88,980 related to corporate restructuring and other events of which $29,308 reduced gross profit from
merchandise sales, $3,278 reduced gross profit from service revenue and $56,394 was included in selling, general and administrative
expenses.
(5) Statement of operations data reflects 53 weeks for year ended February 3, 2007 while the other years reflect 52 weeks.
(6) Gross Profit from Retail Sales includes the cost of products sold, buying, warehousing and store occupancy costs. Gross Profit from
Service Center Revenue includes the cost of installed products sold, buying, warehousing, service center payroll and related
employee benefits and service center occupancy costs. Occupancy costs include utilities, rents, real estate and property taxes, repairs
and maintenance and depreciation and amortization expenses. Our gross profit may not be comparable to those of our competitors
due to differences in industry practice regarding the classification of certain costs.
(7) Return on average stockholders’ equity is calculated by taking the net (loss) earnings for the period divided by the average
stockholders equity.
16
10-K