Pep Boys 2007 Annual Report Download - page 72
Download and view the complete annual report
Please find page 72 of the 2007 Pep Boys annual report below. You can navigate through the pages in the report by either clicking on the pages listed below, or by using the keyword search tool below to find specific information within the annual report.-
 1
1 -
2
-
3
-
4
-
5
-
6
-
7
-
8
-
9
-
10
-
11
-
12
-
13
-
14
-
15
-
16
-
17
-
18
-
19
-
20
-
21
-
22
-
23
-
24
-
25
-
26
-
27
-
28
-
29
-
30
-
31
-
32
-
33
-
34
-
35
-
36
-
37
-
38
-
39
-
40
-
41
-
42
-
43
-
44
-
45
-
46
-
47
-
48
-
49
-
50
-
51
-
52
-
53
-
54
-
55
-
56
-
57
-
58
-
59
-
60
-
61
-
 62
62 -
 63
63 -
 64
64 -
 65
65 -
 66
66 -
 67
67 -
 68
68 -
 69
69 -
 70
70 -
 71
71 -
 72
72 -
 73
73 -
 74
74 -
 75
75 -
 76
76 -
 77
77 -
 78
78 -
 79
79 -
 80
80 -
 81
81 -
 82
82 -
83
-
84
-
85
-
86
-
87
-
88
-
89
-
90
-
91
-
92
-
93
-
94
-
95
-
96
-
97
-
98
-
99
-
100
-
101
-
102
-
103
-
104
-
105
-
106
-
107
-
108
-
109
-
110
-
111
-
112
-
113
-
114
-
115
-
116
-
117
-
118
-
119
-
120
-
121
-
122
-
123
-
124
-
125
-
126
-
127
-
128
-
129
-
130
-
131
-
132
-
133
-
134
-
135
-
136
-
137
-
138
-
139
-
140
-
141
-
142
-
143
-
144
-
145
-
146
-
147
-
148
 |
 |

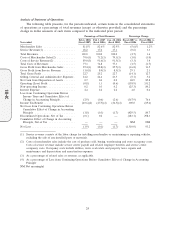
with the early satisfaction and discharge of $119,000,000 4% Senior Convertible Notes due in June,
2007. In fiscal 2007, we experienced a lower weighted average interest rate and lower debt levels.
Non-operating income as a percentage of total revenues decreased from 0.3% in fiscal 2006 to
0.2% in fiscal 2007. This decrease in dollars of $1,777,000 was due to the shorter investment period of
available funds in fiscal 2007 as compared to fiscal 2006.
Discontinued operations was a loss, net of tax, of $3,601,000 in fiscal 2007 versus income, net of
tax, of $4,333,000, in fiscal 2006. Fiscal 2007’s loss resulted primarily from the impairment charges and
closure costs associated with the 11 stores closed in the fourth quarter that were reclassified to
discontinued operations. Fiscal 2006’s results for such locations includes a gain, net of tax, of $4,468,000
on the sale of one location.
Our income tax benefit as a percentage of loss from continuing operations before income taxes
and cumulative effect of change in accounting principle was 40.6% or $25,594,000 versus 47.5% or
$6,399,000. The decrease in the effective tax rate is primarily due to a non cash adjustment of
$2,451,000 to our state deferred liabilities resulting from a change in our filing position in 2006, offset
by an additional tax benefit of $4,227,000 recorded in 2007 relating to uncertain tax positions for tax
years closed due to the statute of limitations and lower effective state tax rates.
Fiscal 2006 vs. Fiscal 2005
Total revenues for fiscal 2006 increased 1.2%. Fiscal 2006 included 53 weeks versus 52 weeks in
fiscal 2005. The 1.2% increase in revenue was the result of an additional week of sales along with
increased improvement in our service counter operations. On a 52 week basis, we had a decrease in
comparable revenues of 0.2%. Comparable service revenue increased 1.3% while comparable
merchandise sales decreased 0.5%. All stores that are included in the comparable sales store base as of
the end of the period are included in our comparable data calculations. Upon reaching its 13th month
of operation, a store is added to our comparable sales store base. Stores are removed from the
comparable sales store base upon their relocation or closure. Once a relocated store reaches its
13th month of operation at its new location, it is added back into our comparable sales store base.
Square footage increases are infrequent and immaterial and, accordingly, are not considered in our
calculations of comparable data.
Gross profit from merchandise sales increased, as a percentage of merchandise sales, to 28.8% in
fiscal 2006 from 25.7% in fiscal 2005. The increase in dollars was $63,257,000 or a 13.5% increase from
the prior year. This increase, as a percentage of merchandise sales, was due to improved product
margins and decreased warehousing costs partially offset by higher occupancy costs. The increase in
merchandise margins resulted from the restructuring of our vendor agreements, lower freight costs and
lower acquisition costs. Effective January 29, 2006, substantially all of our vendor agreements were
restructured to no longer identify specific incremental expenses for cooperative advertising; therefore
all vendor support funds are now treated as a reduction of inventories and are recognized as an
increase to gross profit from merchandise sales when the inventories are sold, in accordance with
EITF 02-16. Gross profit from merchandise sales from fiscal 2006 improved by approximately
$37,100,000 compared to fiscal 2005, primarily as a result of these changes. Warehousing costs were
reduced due to a more efficient store replenishment schedule and the absence in fiscal 2006 of certain
costs associated with the fiscal 2005 relocation of our Southern California distribution center. Increased
occupancy costs were the result of higher utility costs and higher depreciation expense associated with
our store remodel program. Our gross profit classification may not be comparable to the classification
used by certain other entities. Some entities (including us) include distribution, store occupancy, buying
and other costs in cost of goods sold. Other entities exclude such costs from gross profit, including
them instead in general and administrative and / or sales and marketing expenses.
26
10-K