Pep Boys 2007 Annual Report Download - page 63
Download and view the complete annual report
Please find page 63 of the 2007 Pep Boys annual report below. You can navigate through the pages in the report by either clicking on the pages listed below, or by using the keyword search tool below to find specific information within the annual report.-
 1
1 -
2
-
3
-
4
-
5
-
6
-
7
-
8
-
9
-
10
-
11
-
12
-
13
-
14
-
15
-
16
-
17
-
18
-
19
-
20
-
21
-
22
-
23
-
24
-
25
-
26
-
27
-
28
-
29
-
30
-
31
-
32
-
33
-
34
-
35
-
36
-
37
-
38
-
39
-
40
-
41
-
42
-
43
-
44
-
45
-
46
-
47
-
48
-
49
-
50
-
51
-
52
-
 53
53 -
 54
54 -
 55
55 -
 56
56 -
 57
57 -
 58
58 -
 59
59 -
 60
60 -
 61
61 -
 62
62 -
 63
63 -
 64
64 -
 65
65 -
 66
66 -
 67
67 -
 68
68 -
 69
69 -
 70
70 -
 71
71 -
 72
72 -
 73
73 -
74
-
75
-
76
-
77
-
78
-
79
-
80
-
81
-
82
-
83
-
84
-
85
-
86
-
87
-
88
-
89
-
90
-
91
-
92
-
93
-
94
-
95
-
96
-
97
-
98
-
99
-
100
-
101
-
102
-
103
-
104
-
105
-
106
-
107
-
108
-
109
-
110
-
111
-
112
-
113
-
114
-
115
-
116
-
117
-
118
-
119
-
120
-
121
-
122
-
123
-
124
-
125
-
126
-
127
-
128
-
129
-
130
-
131
-
132
-
133
-
134
-
135
-
136
-
137
-
138
-
139
-
140
-
141
-
142
-
143
-
144
-
145
-
146
-
147
-
148
 |
 |

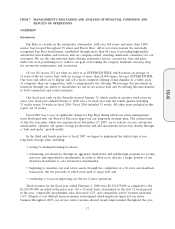
ITEM 7 MANAGEMENT’S DISCUSSION AND ANALYSIS OF FINANCIAL CONDITION AND
RESULTS OF OPERATIONS
OVERVIEW
Introduction
Pep Boys is a leader in the automotive aftermarket, with over 560 stores and more than 5,800
service bays located throughout 35 states and Puerto Rico. All of our stores feature the nationally
recognized Pep Boys brand name, established through more than 80 years of providing high-quality
automotive merchandise and services, and are company-owned, ensuring chain-wide consistency for our
customers. We are the only national chain offering automotive service, accessories, tires and parts
under one roof, positioning us to achieve our goal of becoming the category dominant one-stop shop
for automotive maintenance and accessories.
Of our 562 stores, 552 are what we refer to as SUPERCENTERS, which feature an average of
11 state-of-the-art service bays, with an average of more than 20,000 square feet per SUPERCENTER.
Our store size allows us to display and sell a more complete offering of merchandise in a wider array
of categories than our competitors, with a comprehensive tire offering. We leverage this investment in
inventory through our ability to install what we sell in our service bays and by offering this merchandise
to both commercial and retail customers.
Our fiscal year ends on the Saturday nearest January 31, which results in an extra week every six
years. Our fiscal year ended February 2, 2008 was a 52-week year with the fourth quarter including
13 weeks versus 14 weeks in fiscal 2006. Fiscal 2006 included 53 weeks. All other years included in this
report are 52 weeks.
Fiscal 2007 was a year of significant change for Pep Boys during which our entire management
team developed and, our Board of Directors approved, our long-term strategic plan. The cornerstones
of this five-year plan, which was announced on November 27, 2007, are to refocus on core automotive
merchandise, optimize our square footage productivity and add incremental service bay density through
a ‘‘hub and spoke’’ growth model.
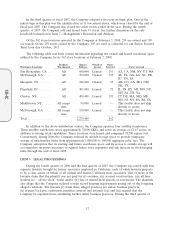
In the third and fourth quarters of fiscal 2007, we began to implement the initial steps of our
long-term strategic plan, including:
• closing 31 underperforming locations;
• rebalancing our inventory through an aggressive mark down and sell-through program for certain
non-core and unproductive merchandise in order to allow us to allocate a larger portion of our
inventory investment to core automotive merchandise;
• beginning to monetize our real estate assets, through the completion of a 34 store sale-leaseback
transaction, the net proceeds of which were used to repay debt and
• continuing to focus on improving our Service Center operations.
Total revenues for the fiscal year ended February 2, 2008 were $2,138,075,000 as compared to the
$2,243,855,000 recorded in the prior year. On a 52-week basis, determined as the first 52 week period
in the year, comparable merchandise sales decreased 4.2% and comparable service revenue increased
1.8%. Despite a very difficult macroeconomic environment which negatively impacted our entire
business throughout 2007, our service center revenue showed steady improvement throughout the year.
17
10-K